The image says the title of the article: Economic & Market Update Q4 2023 by Jane Swan & Roraj Pradhanaga

Veris Economic and Market Update: Q4 2023

By Jane Swan, CFA and Roraj Pradhananga, CIMA & CPA

The US economy remains resilient, supported by strong retail spending and labor markets and signs of improving consumer confidence¹ and strengthening in housing markets. 

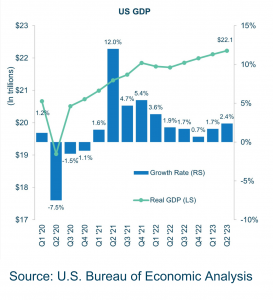
In the third quarter of 2023, GDP grew at its fastest rate in nearly two years – driven by consumer and government spending and private inventory investment.² However, we believe recent indications signal that economic growth is slowing down. The US Manufacturing Purchasing Managers’ Index (PMI) was in negative territory as of Q4 2023.³ ⁴  Consumer debt is also increasing,⁵ indicating that retail spending may be driven by borrowing as pandemic era savings dwindle. The 4th quarter GDP estimate, currently at 2.4%, suggests the economy has remained strong.

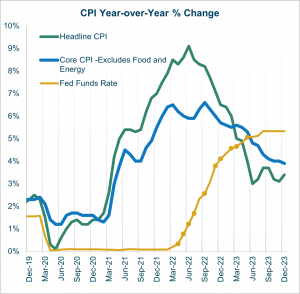
Inflation Dropped in the US in 2023

Source: Bureau of Labor Statistics

Source: Bureau of Labor Statistics

Meanwhile, inflation cooled substantially in 2023. Headline inflation dropped meaningfully to 3.4% in December 2023 from the peak of 9.1% in June 2022 due to the Fed’s decision to keep interest rates higher for longer to further tame inflation and the post-pandemic supply chain continued to recover. 

The disinflation (reduction in the rate of inflation) in 2023 reinforced market expectations of a soft landing. The inflation rate declining so steeply without igniting a recession, thus far, appears to have been achieved. Slowing inflation is not distributed equally across all sectors of the economy. We believe that various components, including shelter, food, and energy, will likely continue to drive monthly fluctuation in headline inflation.

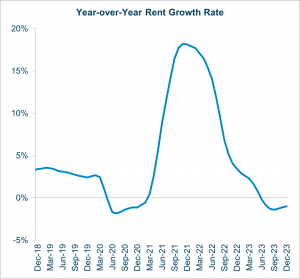
Apartment List Rent Growth Rates

Source: ApartmentList.com

The Fed is data-dependent rather than headline dependent and focuses on core CPI which eased in the quarter but remains above the Fed’s 2% target. Shelter remains the main driver of increases in core CPI at 6.2% year-over-year as most rental contracts are at least one-year long, but leading indicators predict lower shelter prices. 

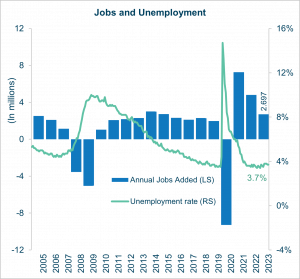
US Labor Market Strength

The US labor market remains strong despite slight increases from its 50-year low in early 2023. Non-farm payroll employment and weekly jobless claims continue to surprise to the upside despite announcements of layoffs by many companies. 

Sources: U.S. Bureau of Economic Analysis, FRED, and U.S. Bureau of Labor Statistics

Sources: U.S. Bureau of Economic Analysis, FRED, and U.S. Bureau of Labor Statistics

The unemployment rate of 3.7% remains low compared to recent history. Since 2000, if we exclude the 12 months starting March 2020 (COVID), the average unemployment rate has been 5.6%. US employers added 2.7 million jobs in 2023, exceeding jobs added annually pre-pandemic. Positive wage growth confirms a tight labor market, however, the number of job openings plus hires and quit rates are trending downwards indicating some softening. 

Consumer Spending & Debt 

Sources: FRED and Federal Reserve Bank of Philadelphia

Sources: FRED and Federal Reserve Bank of Philadelphia

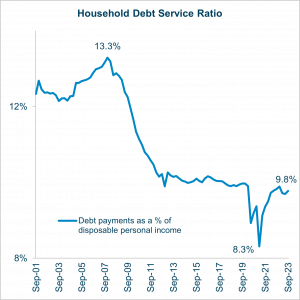
Consumer spending remains strong, though all but the wealthiest 20% of households have depleted most of their excess savings and are taking on more debt. The household debt service ratio increased from 8.3% in Q1 2021 to 9.8% in Q3 2023.¹⁰ This means that, on average, almost 10% of a household’s budget is consumed by debt service.

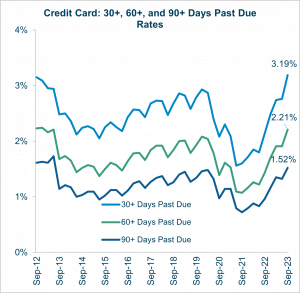
Credit Card Past Due Rates q4 2023

Sources: FRED and Federal Reserve Bank of Philadelphia

The high interest rates targeting inflation continue to put significant strains on poor Americans who are hardest hit by inflation. Similarly, delinquency and defaults rates are rising across all consumer loans. After reaching historical lows in Q2 2021, credit card delinquency rates have been steadily increasing and have surpassed pre-pandemic levels.¹¹

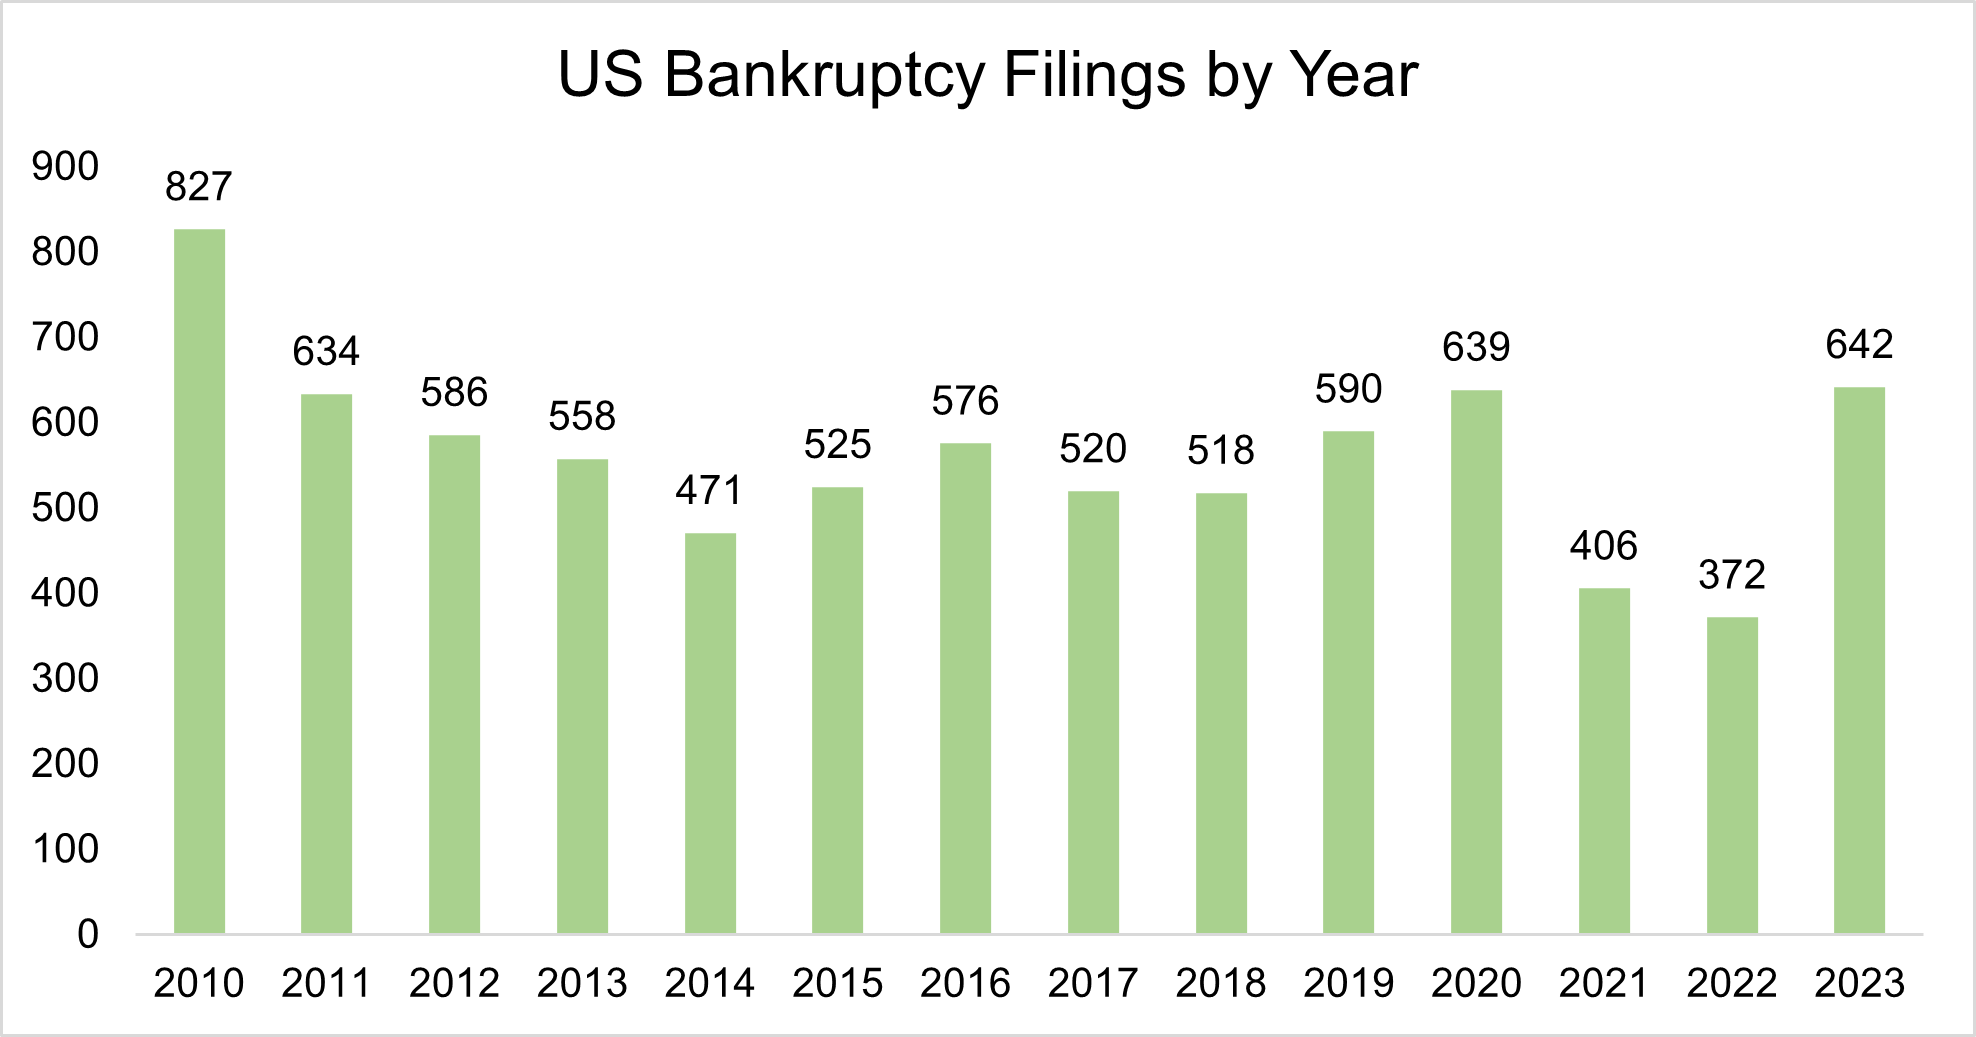
It is not only the consumer delinquencies and defaults that are rising. Corporate bankruptcy filings also rose in 2023 as a result of higher cost of funding driven by higher interest rates and higher expenses. According to S&P, 642 companies filed for bankruptcy in 2023, significantly higher than the previous two years and slightly higher than 2020.¹² Consumer discretionary, healthcare, and industrial sectors accounted for 243 of the total bankruptcy filings.¹³ 

Source: SPGlobal.com

Market Activity

In the second half of Q4, the markets matched the optimistic economic forecasts for a soft landing. Markets soared at year-end in anticipation of aggressive rate cuts by the Fed in 2024. As a result, Treasury yields dropped meaningfully across the curve resulting in a broad-market rally into year-end. 

US equities posted double-digit returns and fixed income indices generated positive returns. US domestic equities outperformed international developed and emerging markets due to increased optimism of the US economy and performance of US companies. High yield was the best performing fixed income segment, but the tight spreads to Treasury yields appear ambivalent to the commonly associated risk of default in lower quality debt. ​

Magnificent Seven

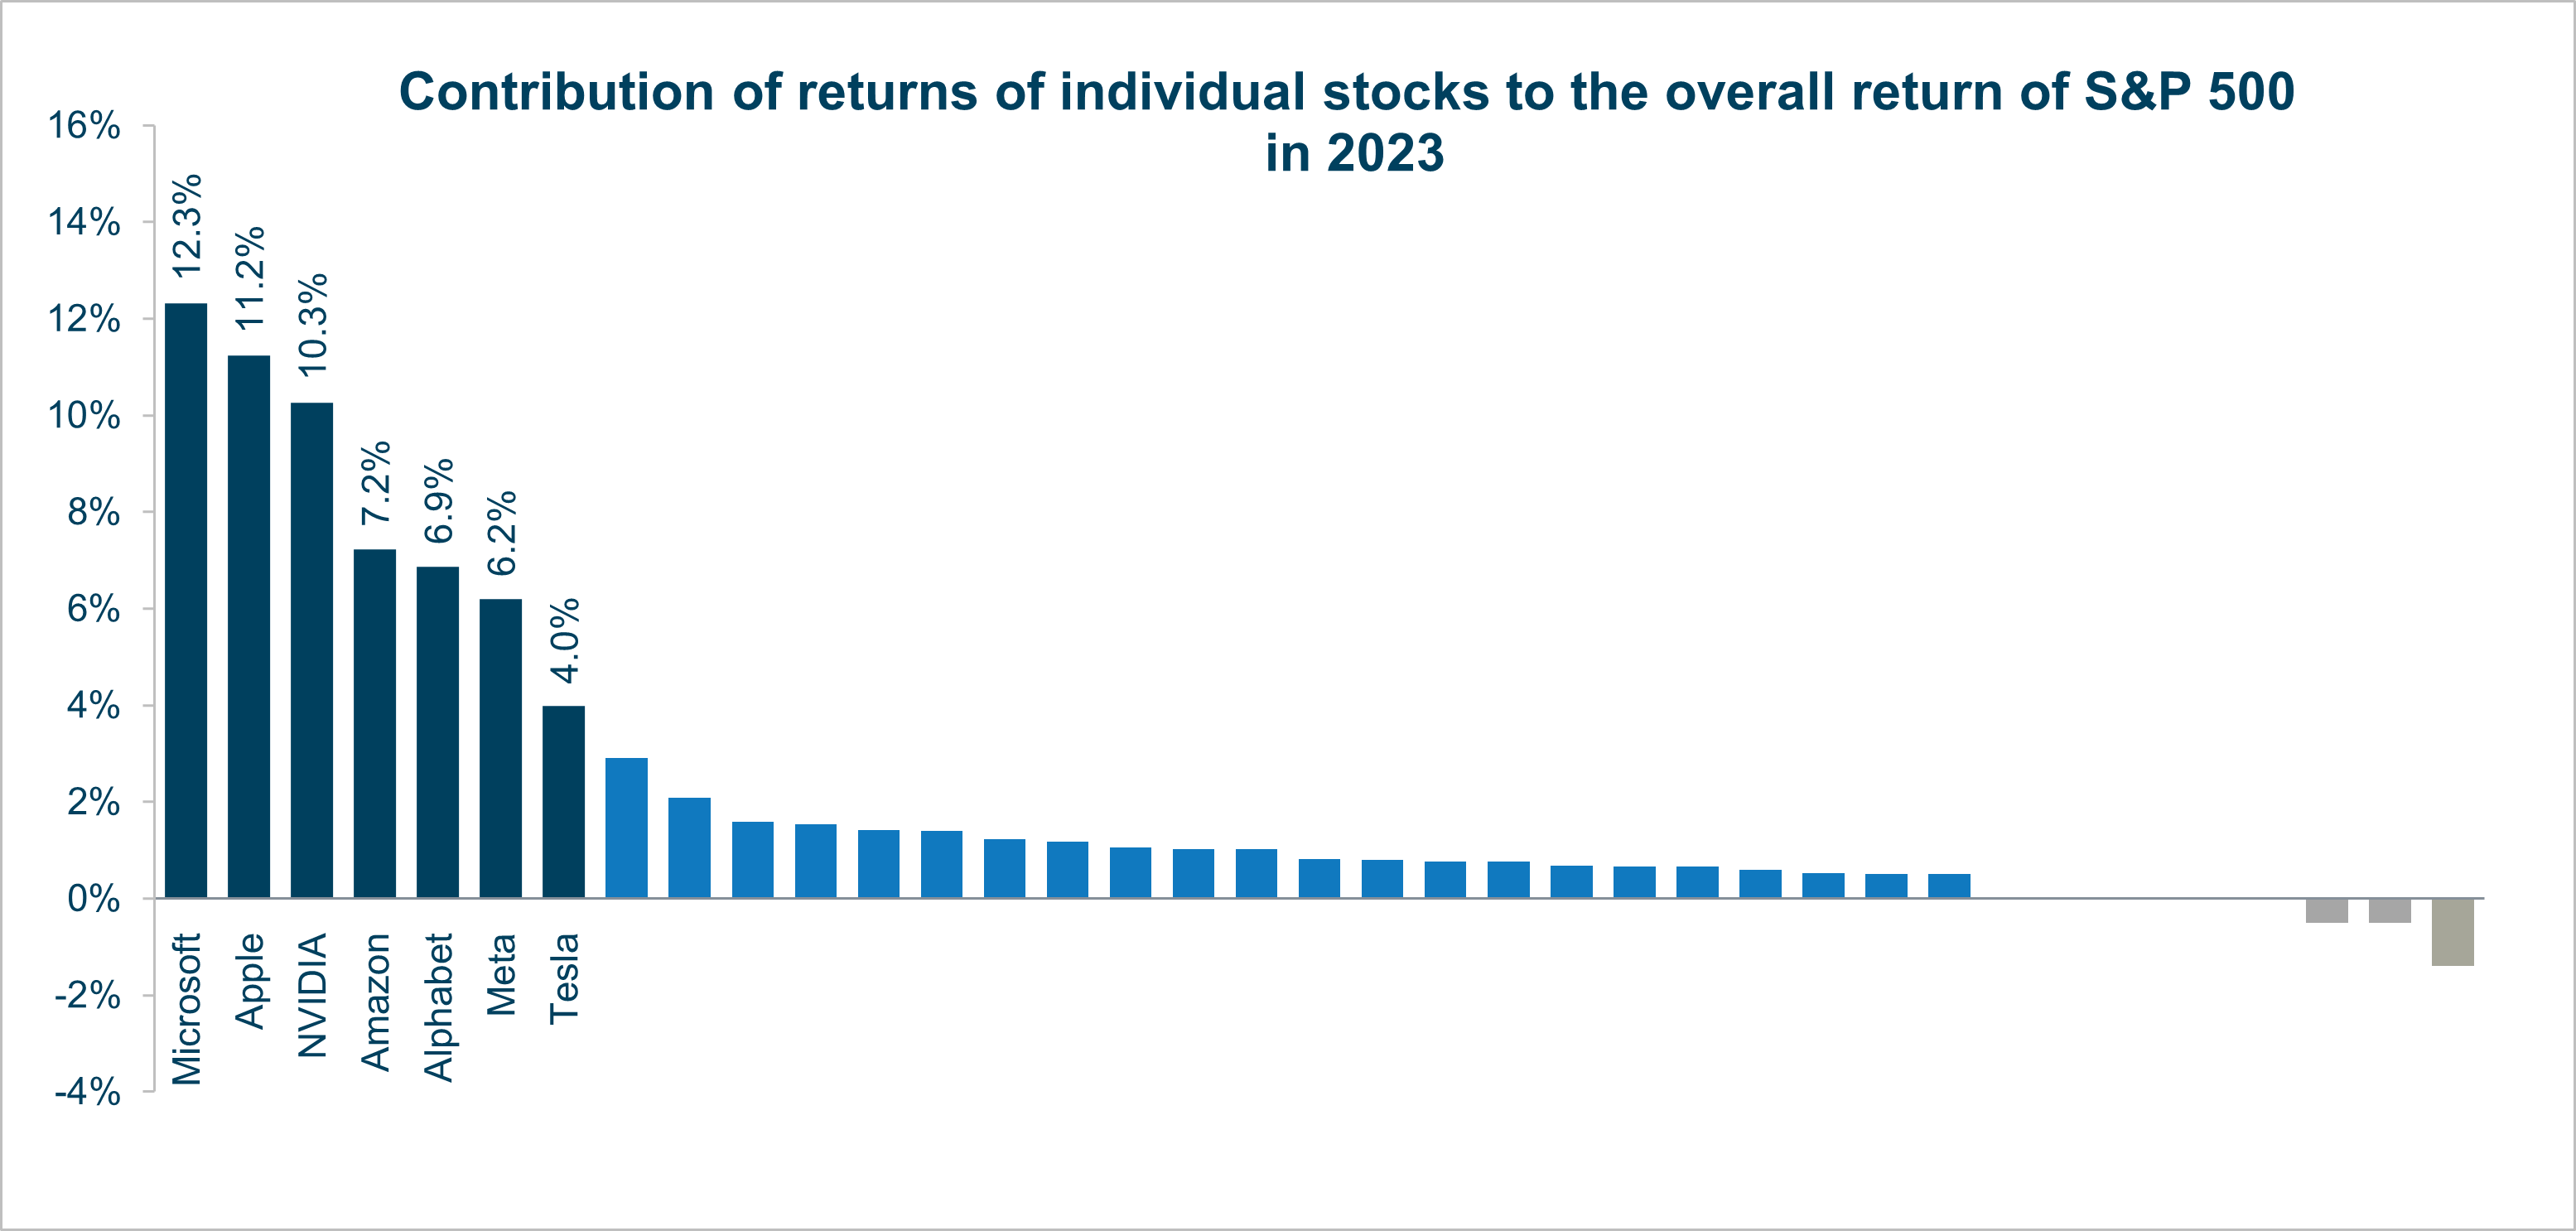
The seven US large-cap companies nicknamed the “Magnificent Seven” – Microsoft, Apple, Nvidia, Meta, Amazon, Tesla, and Alphabet – were responsible for more than half of the stock market gains in 2023. 

Magnificent Seven chart q4 2023. Data source: Morningstar

Source: Morningstar

The market rally in late Q4 spread across a higher number of stocks, thereby reducing the contribution of the Magnificent Seven to total returns for the year. Despite that, the Magnificent Seven represented approximately 26% of the S&P 500 Index weight and accounted for 58% of the S&P 500 Index returns for the year.¹⁴ 

The concentration is not just limited to the US market index. As of the end of 2023, Apple (19.5%), Microsoft (17.2%), and Nvidia (7.9%) together accounted for approximately 45% of the MSCI ACWI Information Technology index, Alphabet (Class A 16.8% & Class C 14.9%) and Meta (15.9%) account for approximately 48% of the MSCI ACWI Communication Services, and Amazon (18.9%) and Tesla (9.5%) account for about 29% of MSCI ACWI Consumer Discretionary index. 

The concentration and contribution to returns of the “Magnificent Seven” are reflected in sector performance for the year. All sectors of the S&P 500 except Energy posted positive returns in Q4. Cyclical sectors outperformed defensive sectors. A recession or economic slowdown would likely weigh more heavily on cyclical sectors than on defensive ones. The Artificial Intelligence exuberance that drove the Magnificent Seven stocks higher in the first half of 2023 helped Technology, Communication Services and Consumer Discretionary sectors generate returns in excess of 40% for the full year 2023. 

The concentration of the top 10 stocks in the S&P 500 and Magnificent Seven stocks within their respective three sectors remain at historic highs and resulted in benchmark risk, style biases and exposure to potential turn in investor sentiment towards these stocks. 

Focus on the Energy Sector 

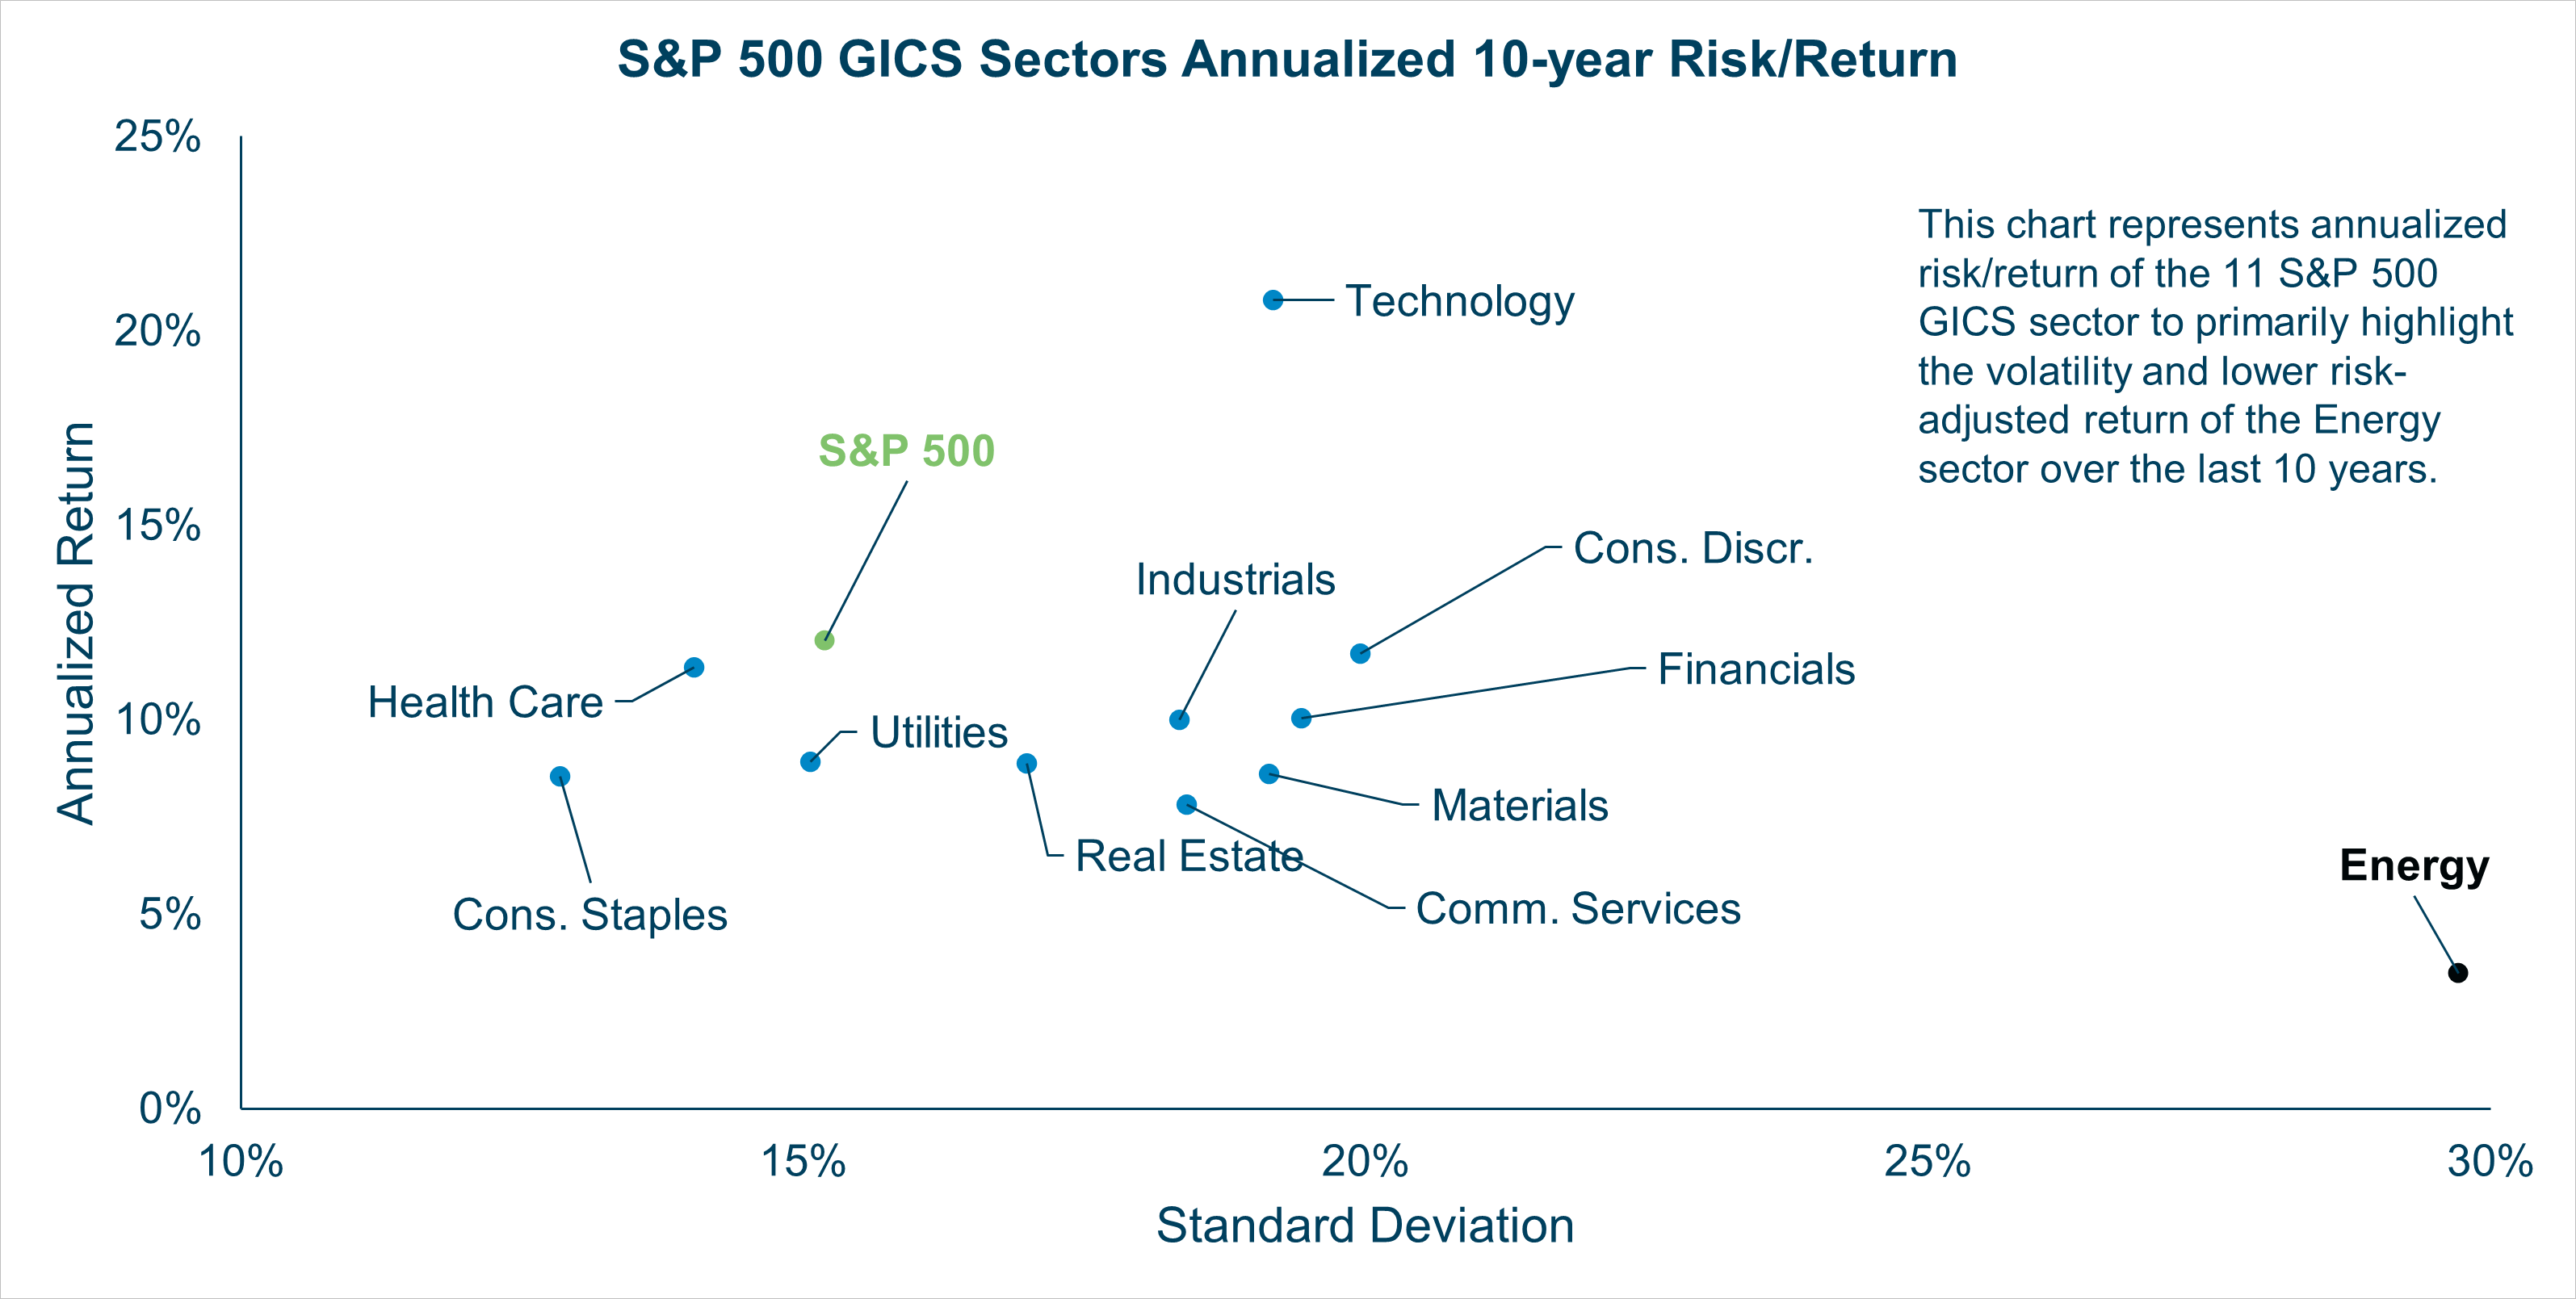
Despite the headline-grabbing 36.2% 3-year annualized returns, the Energy sector had negative returns in Q4 and 2023 and has trailed the other sectors on a risk-adjusted basis over 10 years. 

Source: Morningstar

While the ongoing Russia-Ukraine and Israel-Hamas wars and reductions in oil and gas supply from Saudi Arabia and Russia provided short-term tailwinds to the traditional energy sector, we believe significant long-term headwinds include reduced demand and declining costs of renewable energy, transmission, and storage solutions.

Future Considerations

The Fed announced that it would maintain its policy rate in the range of 5.25% to 5.5% on January 31st for the fourth straight meeting. Chairman Powell acknowledged that further rate hikes are not likely and downplayed the likelihood of a rate cut in March but suggested that the Fed might cut rates sometime in 2024.¹⁵

While inflation has come down meaningfully, it remains higher than the Fed’s target of 2% and the Fed wants to see more evidence of sustained lower inflation before cutting rates amidst strong labor market and monthly inflation fluctuations. 

The S&P 500, Nasdaq composite and the Dow lost 1.6%, 2.2% and 0.8%, on January 31st as the markets expected a rate cut in March.¹⁶ A decision by the Fed to not cut rates in future meetings may result in markets reacting negatively in the future, as the markets continue to expect rate cuts in 2024.

With the S&P 500 hitting a new high in January, it is timely to consider cash needs for the year and beyond. Please contact your Veris Advisor to consider your impact and spending goals for 2024.

Authors

Jane Swan is a Partner & Senior Advisor at Veris Wealth Partners and holds the Chartered Financial Analyst (CFA®) designation. 

Roraj Pradhananga is a Partner & Managing Director of Investments at Veris Wealth Partners and a Certified Investment Management Analyst (CIMA®) and Certified Public Accountant (CPA). 

Disclaimer

The information contained herein is provided for informational purposes only and should not be construed as the provision of personalized investment advice, or an offer to sell or the solicitation of any offer to buy any securities. Rather, the contents including, without limitation, any forecasts and projections, simply reflect the opinions and views of the authors.

All expressions of opinion reflect the judgment of the authors as of the date of publication and are subject to change without notice. There is no guarantee that the views and opinions expressed herein will come to pass. Additionally, this document contains information derived from third party sources. Although we believe these third-party sources to be reliable, we make no representations as to the accuracy or completeness of any information derived from such third-party sources and take no responsibility, therefore. Information related to the performance of certain benchmark indices is provided for illustrative purposes only as investors cannot invest directly in an index. Past performance is not indicative of or a guarantee of future results. Investing involves risk, including the potential loss of all amounts invested.

Veris Economic and Market Update Q3 2023

By Jane Swan, CFA and Roraj Pradhananga, CPA

The first quarter of 2023 was characterized by major events such as the failure of Silicon Valley Bank, escalating concern of a pending recession. Sentiment made an about face in the second quarter, buoyed by limitless enthusiasm for artificial intelligence. At the end of the third quarter, we seemed to have settled into an uncomfortable normalcy: uncertainty.

The labor market remains tight despite slowing job growth in 2023. The unemployment rate remains low at 3.8% despite increasing 0.2% in Q3.¹ Employees are losing confidence in their job prospects, as shown by recent declines in the Conference Board survey and stalling of the quits rate. 

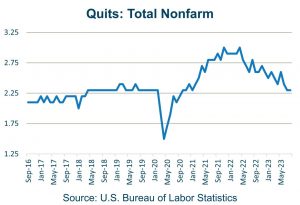
Quits: Total NonfarmThe quits rate, measuring the number of quits as a percentage of the employment, peaked in April of 2022 at 3%. In the third quarter it fell to 2.3%, equivalent to the rate in February of 2020. The fall in quits suggests workers are less certain they will easily find replacement jobs if leaving their current job. 

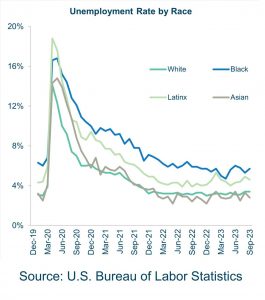
Unemployment Rate by RaceThe unemployment rate for Black Americans dropped slightly to 5.7% from 6% in June, it remains elevated compared to white and Asian Americans. 

The US economy remains tepid but resilient, supported by strong labor and housing markets. While growth remains positive, up 2.4% in the second quarter and preliminary estimates suggesting annualized growth accelerated to 4.9% in the third quarter, there are signs of slowing economic momentum.³

GDP ChartConsumer balance sheets remained strong, but the bottom 80% of households have depleted most of their excess savings and are taking on more debt.⁴ Default rates on auto loans are higher now than at any point in recorded history. Borrowers with high credit scores may feel current new car loan rates around 5% are high, but that pales in comparison to rates over 14% which are paid by people with low credit scores. We believe the mounting debt strain on consumers, along with higher interest rates and energy prices, the uncertainty of potential government shutdown in November, and the forthcoming resumption of student loan payments, will weigh on consumer spending and economic growth. This is discussed further in our Quarterly Impact Focus report. 

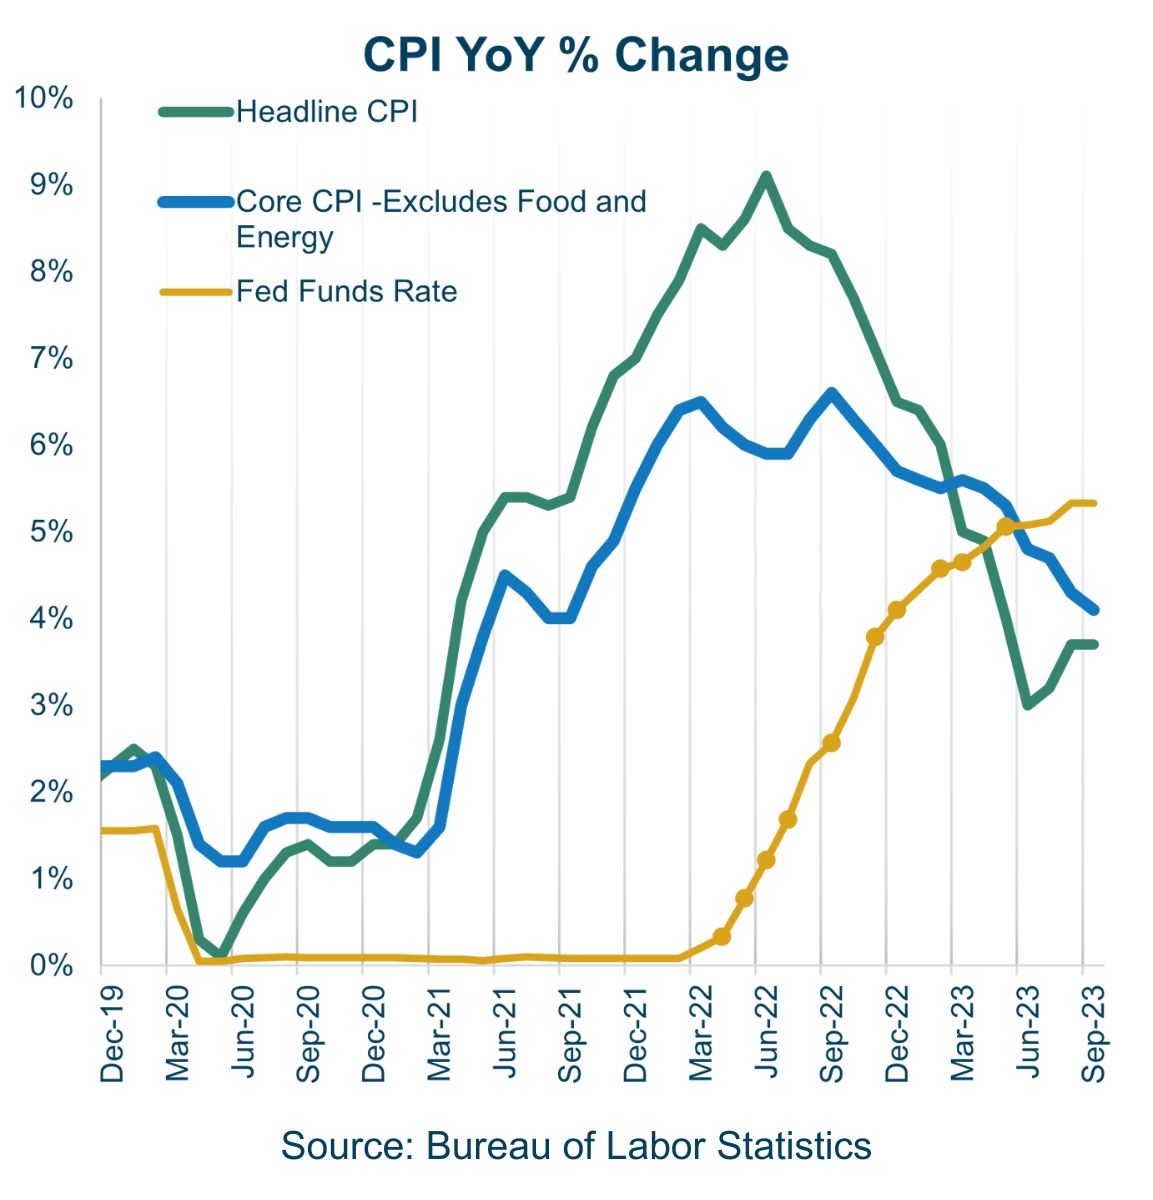
A sustained inflation downtrend has been in place since June 2022, when it peaked at 9.1%, falling to 3.7% in September. 

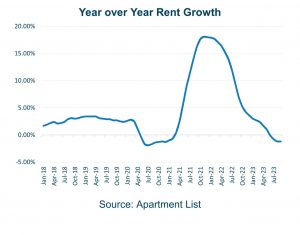
While core CPI remains abovYear over year growthe the Fed’s 2% target, there are reversals in major categories that drove inflation higher in the last two years such as easing vehicle prices, reflective of improving supply chains. Shelter remains the main driver of increases in core CPI, but leading indicators are predicting lower shelter prices ahead.

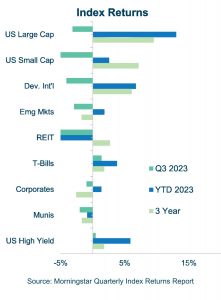
Index ReturnsAfter strong gains in the first half of 2023, global equities posted a negative return in Q3. 

Most of the “Magnificent Seven” (Apple, Microsoft, Alphabet, Nvidia, Amazon, Meta, Tesla) declined in August and September, retreating from the perhaps over enthusiasm in Q2. Fed officials continued to convey higher rates would be needed for longer to contain higher than expected inflation. In response, US equities trended lower. Bond markets also mostly declined in Q3 as yields increased meaningfully. 

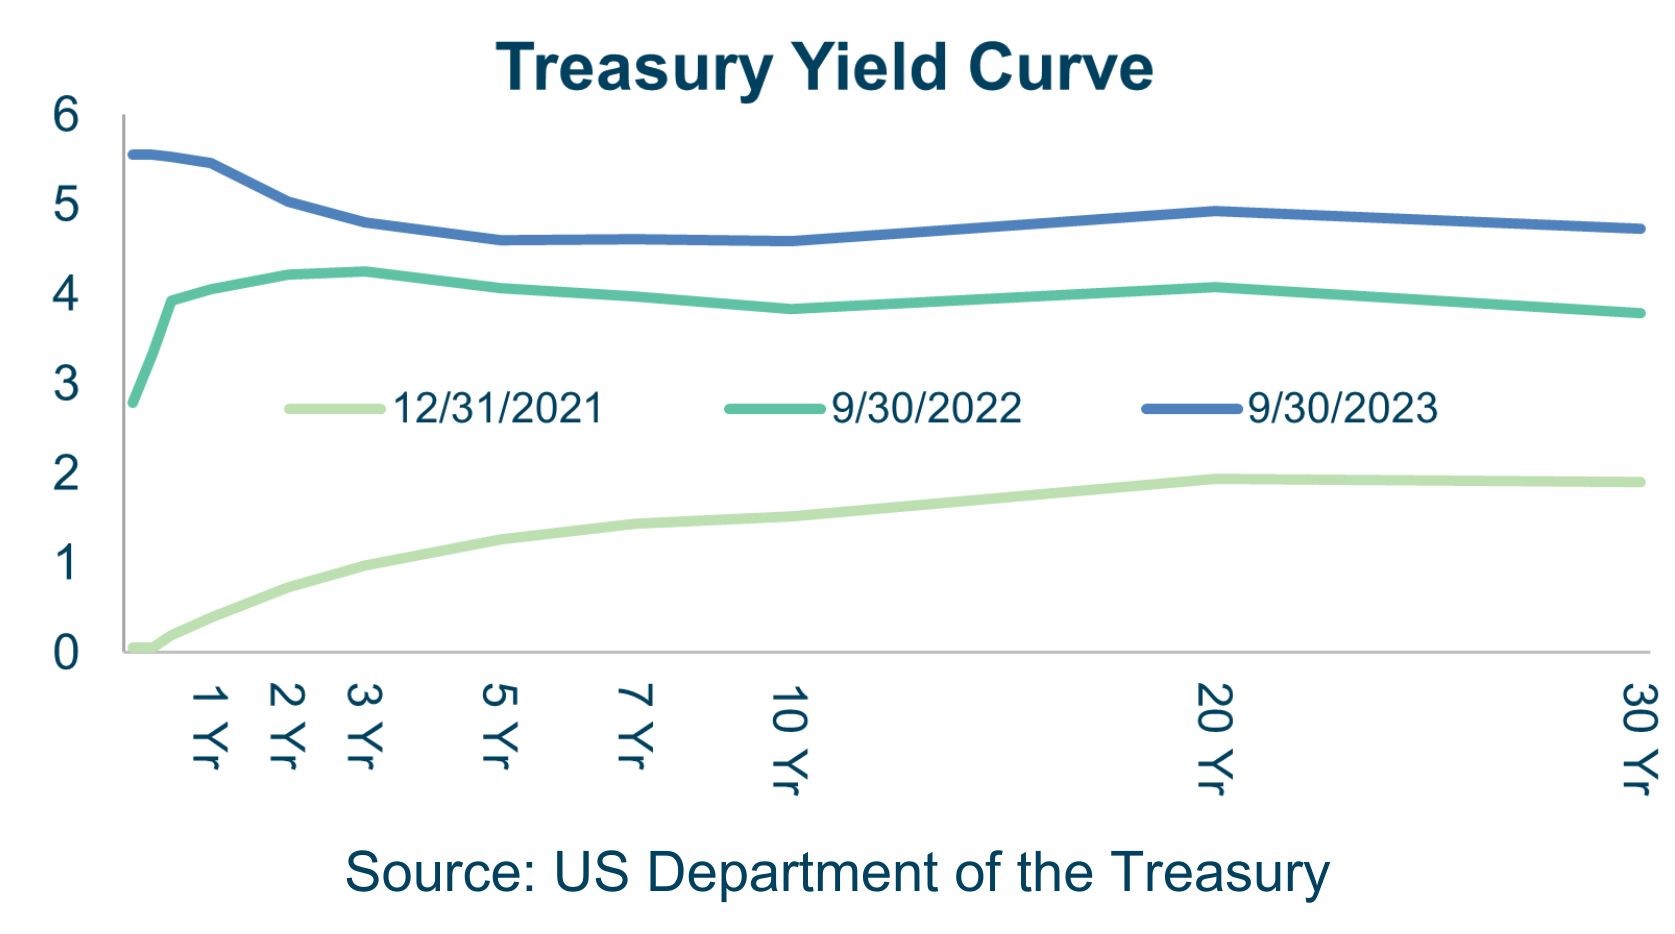
The yield increase was more pronounced on the longer end of the yield curve due to concerns over US debt levels and large Treasury issuance to fund the deficit. This prompted investors to demand higher yields for taking on longer duration risk.

CPY yoy change

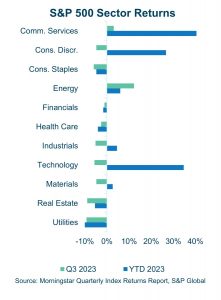
Energy and Communications Services were the two sectors with a positive return during the third quarter, returning 12.2% and 3.1%, respectively. 

S&P Sector ReturnsAfter leading performance in the first half of 2023, Information Technology declined 5.6%, with the reversal led by Apple, Microsoft, and Nvidia, followed by Tesla and Meta. The Energy sector continues to benefit amid oil production cuts from Saudi Arabia and Russia and the Israel-Hamas war.

Despite the headline grabbing 12.2% QTD and 51.2% 3-year returns, the Energy sector has trailed the other sectors on a risk-adjusted basis over 10 years. 

The height of each point on this graph represents the average return of the sector over the last 10 years. The distance from left to right measures the volatility of each sector, with less volatile sectors to the left and more volatile sectors to the right. The graph shows that over this period, energy had both the lowest returns and the highest volatility, by a significant margin, of all sectors in the S&P 500. While the ongoing war in Ukraine and related reductions in oil and gas supply from Saudi Arabia and Russia add to short-term tailwinds in the sector, we believe significant long-term headwinds for the sector include declining costs of renewable energy, transmission and storage solutions.

The stock market ended the quarter 11% lower than the highs reached towards the end of 2021, which is 16% higher than lows we saw one year ago.¹¹ As of the time of this report, the uncertainty around the Israel-Hamas war and the potential government shutdown could lead to further volatility and downside risks to markets. Fragility in the stock market recovery, along with significant uncertainty from geopolitical events and our wildly volatile political paths ahead serve as a reminder to evaluate expected spending needs and to check cash reserves, in consultation with your Veris advisors. 

Related reading: Impact Focus Q3 2023: Inflation, Interest Rates, and Corporate Profits

Authors

Jane Swan is a Partner & Senior Advisor at Veris Wealth Partners and a Chartered Financial Analyst (CFA®). 

Roraj Pradhananga is a Partner & Managing Director of Research at Veris Wealth Partners and a Certified Public Accountant (CPA).

Sources

Disclaimer

The information contained herein is provided for informational purposes only and should not be construed as the provision of personalized investment advice, or an offer to sell or the solicitation of any offer to buy any securities. Rather, the contents including, without limitation, any forecasts and projections, simply reflect the opinions and views of the authors.

All expressions of opinion reflect the judgment of the authors as of the date of publication and are subject to change without notice. There is no guarantee that the views and opinions expressed herein will come to pass. Additionally, this document contains information derived from third party sources. Although we believe these third-party sources to be reliable, we make no representations as to the accuracy or completeness of any information derived from such third party sources and take no responsibility therefore. Information related to the performance of certain benchmark indices is provided for illustrative purposes only as investors cannot invest directly in an index. Past performance is not indicative of or a guarantee of future results. Investing involves risk, including the potential loss of all amounts invested.
Impact Focus Q3 2023: Inflation, Interest Rates, and Corporate Profits

By Jane Swan, CFA

In the hours approaching the end of the third quarter of 2023, Congress passed a bipartisan 45-day funding bill, temporarily preventing a government shutdown. At the time, President Biden prematurely expressed optimism for continuing engagement with Speaker McCarthy in a bipartisan process to approve a budget, including ongoing aid to Ukraine.1 Within two days, Representative Gaetz of Florida began the process of removing McCarthy as Speaker. That effort succeeded on October 3rd.  The need to organize new leadership and pass a budget was eclipsed by the humanitarian crisis in Israel and Gaza. 

Three weeks and three failed speaker candidates later, the Republican House majority elected far-right Republican Mike Johnson. Mike Johnson supported and played a key role in former President Trump’s effort to undermine the results of the 2020 election. The new Speaker could drive further uncertainty in policymaking as bipartisanship will be further out of reach. 

The need for leadership and the importance of passing a budget is crucial for maintaining a stable economy and providing financial, humanitarian, and diplomatic support to Ukraine and now also in the Middle East. Additionally, inflation continues to infuse the economy, markets, and consumers with increasing uncertainty. 

In this impact-focused review of Q3 2023, we will pay close attention to the relationships between income inequality, inflation, and corporate profits. You can read our overview of economic and market activity in Q3 here

For several reasons, inflation has a greater impact on low-income, low-wealth families than those with higher incomes or high wealth. Non-discretionary items like food, housing, and fuel tend to make up a higher percentage of their household spending.2 Families with more financial privileges can cope with inflation through prudent choices, such as buying generic rather than luxury brands, reducing travel and restaurant consumption, as well as limiting retail choices.3 Over the last 20 months, the Federal Reserve (The Fed) has aggressively raised interest rates, making 11 hikes for a total increase of 5%. In doing so, Fed officials have often cited the disproportionate impact inflation has on low-income families.4

However, when we look at how inflation hurts low-income families, interest rate hikes frame a scenario where the cure is potentially worse than the disease. When interest rate hikes discourage spending, the result can be an increase in unemployment. This harms workers who lose jobs, as well as the ability for employed people to demand higher wages.5 Historically, women and Black workers have faced the greatest obstacles to employment in periods of high unemployment.6  

The negative impact for low-income families goes beyond potential employment risks.

The bottom 80% of households have depleted most of their excess savings and are taking on more debt.7 Default rates on auto loans are higher now than at any point in recorded history.8 Borrowers with high credit scores may feel current new car loan rates around 5% are high, but that pales in comparison to rates over 14% which are paid by people with low credit scores through subprime loans, which were one of the reasons for the housing market crash in 2007 and 2008.9 The ongoing high interest rates impact low-income households through obvious consequences like interest charges on credit card debt. Additionally, higher interest rates make home ownership even more unattainable to low-income borrowers with less available for down payments, requiring them to finance a higher percentage of home purchases.10 The link between the wealth gap and homeownership is examined in our DEIB Investing report, published this fall. 

Looking at income by decile (5 groups, each representing 20% of income groups) we see that while income has been relatively flat for the bottom 60% of income earners, it has grown steadily for those between 61 and 80%, and sharply for the top 20% of income earners.11 

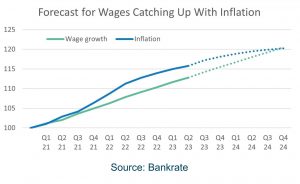
Suppressed wage growth for lower earners over recent decades makes these populations simultaneously vulnerable to inflation and high interest rates. While wage growth on average has been higher through the COVID recovery and high inflation period, it is estimated that it will take another year for those wage hikes to make up for the negative income effect of inflation. 

As The Fed works to combat inflation, we believe it is important to examine how prices are set, and some potential causes of inflation. A producer of goods and services usually sets a price based on the costs of production (including labor) and marks up the price to add a profit. If they include too much profit in the price, consumers may look for substitute goods. If consumers choose substitute goods, the producer may decide to reduce the profit from each unit sold to attract more consumers. This is the supply/demand relationship. When wage increases lead to increases in prices and higher inflation, workers are likely to demand even higher wages. This is known as the wage-price spiral.

At the first signs of inflation in 2021, The Fed and many analysts expected that the inflation was “transitory” or temporary.12 Supply chain and a tight labor market were seen as temporary problems that would resolve with remedies to supply-chain constraints and stabilization of the tight labor market.13 As high inflation has persisted beyond the period of significant supply chain constraints and as wages have grown less than inflation, analysis in 2023 has increasingly included examination of increasing corporate profits as a significant contributor to inflation. In February of 2023, The Fed was pointing to signs that the wage growth was moderating and began to shift some focus to what they called “The wage-price spiral.”14

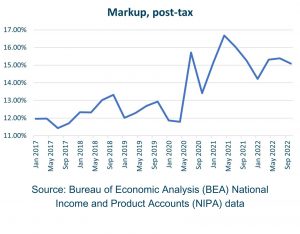
graph depicting markup, post tax

The “Mark Up” in prices, which increased during and after COVID has protected corporate earnings while contributing to inflation.15 

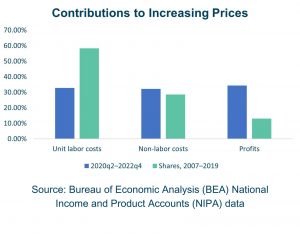
From 2020 to 2022, non-labor cost changes as a component of increasing prices stayed about the same as they were from 2007-2019, changing from 28.6% pre-COVID to 32.3% during and after COVID. Comparing these same time periods, unit labor costs as a component of increasing prices actually went down from 58.4% to 32.8% during and after COVID.

The biggest change in contributions to iBar graph depicting contributions to increasing pricesncreasing prices came from profits, which were 13.1% of contributions to increasing prices before the pandemic but have been 34.4% of contributions to profits in the years that followed.

Unless corporations reduce prices to reflect improving supply chains and lower prices of inputs, low-income families will not benefit from real wage growth as the rate of inflation subsides. Otherwise, the only beneficiaries are owners and shareholders of these companies. 

All investors, including impact investors, benefit from and are protected by increasing prices. Some impact investors attempt to distinguish ourselves by examining these relationships and exploring and including alternate investments which aim to remedy some of the externalities in our financial systems. Notes in Community Development Financial Institutions (CDFIs) and CDs with Credit Unions can reduce the negative impact of high interest rates on low-income communities by offering subsidized or low-interest loans to borrowers often excluded from traditional bank loans. Some impact investors make investments in companies that seek to remedy inequities in how credit scores ratings are set, taking action towards leveling the playing field. 

For more information on impact solutions to the problems of inflation and high interest rates, please see our DEIB Investing Report or speak to your advisor.  

Author

Jane Swan is a Partner & Senior Advisor at Veris Wealth Partners and a Chartered Financial Analyst (CFA®). 

Sources

  1. https://www.whitehouse.gov/briefing-room/statements-releases/2023/09/30/statement-from-president-joe-biden-on-passage-of-the-bipartisan-bill-to-keep-the-government-open/
  2. https://www.dallasfed.org/research/economics/2023/0110#:~:text=Prior%20research%20suggests%20that%20inflation,few%20ways%20to%20reduce%20spending%20.
  3. https://www.minneapolisfed.org/article/2022/as-inflation-rises-low-income-households-grapple-with-particular-challenges
  4. https://ny1.com/nyc/all-boroughs/news/2022/01/11/fed-chair-jerome-powell-inflation-covid-jobs , https://www.stlouisfed.org/publications/bridges/2023/vol3/how-low-moderate-income-households-are-coping-inflation
  5. https://time.com/6253699/federal-reserve-inflation-interest-rates-workers/
  6. https://www.chicagobooth.edu/review/why-rising-interest-rates-could-particularly-hurt-black-workers-women
  7. https://www.bloomberg.com/news/articles/2023-09-25/only-richest-20-of-americans-still-have-excess-pandemic-savings
  8. https://www.bloomberg.com/news/articles/2023-10-21/high-car-loan-interest-rate-payments-americans-struggle-with-monthly-bills
  9. https://www.bankrate.com/loans/auto-loans/average-car-loan-interest-rates-by-credit-score/#average
  10. https://www.npr.org/2023/02/26/1159615312/interest-rate-hikes-widen-the-wealth-gap-an-economist-argues
  11. FRED: Income Before Taxes: Wages and Salaries by Quintiles of Income Before Taxes: By Decile, U.S. Dollars, Annual, Not Seasonally Adjusted
  12. https://www.federalreserve.gov/mediacenter/files/FOMCpresconf20210317.pdf
  13. https://www.nytimes.com/2023/04/07/business/economy/wages-prices.html
  14. https://www.imf.org/en/Blogs/Articles/2023/02/24/wage-price-spiral-risks-still-contained-latest-data-suggests
  15. https://www.epi.org/blog/even-with-todays-slowdown-profit-growth-remains-a-big-driver-of-inflation-in-recent-years-corporate-profits-have-contributed-to-more-than-a-third-of-price-growth/
  16. Ibid

Disclaimer

The information contained herein is provided for informational purposes only and should not be construed as the provision of personalized investment advice, or an offer to sell or the solicitation of any offer to buy any securities. Rather, the contents including, without limitation, any forecasts and projections, simply reflect the opinions and views of the authors.

All expressions of opinion reflect the judgment of the authors as of the date of publication and are subject to change without notice. There is no guarantee that the views and opinions expressed herein will come to pass. Additionally, this document contains information derived from third party sources. Although we believe these third-party sources to be reliable, we make no representations as to the accuracy or completeness of any information derived from such third party sources and take no responsibility therefore. Information related to the performance of certain benchmark indices is provided for illustrative purposes only as investors cannot invest directly in an index. Past performance is not indicative of or a guarantee of future results. Investing involves risk, including the potential loss of all amounts invested.
Veris Wealth Partners presents our firm's Q2 2023 Investment and Economic Review.

Veris Q2 2023 Investment and Economic Review

By Jane Swan, CFA® and Roraj Pradhananga, CPA

Early 2023 offered the economy and markets several hurdles. High inflation, instability in some regional banks, and a looming battle over the debt ceiling each invited speculation of a possible recession. The US economy remains resilient, supported by consumer spending with strong labor and housing markets. Manufacturing data and other leading economic numbers suggest a possible slowdown could still be ahead, and continued interest rate hikes could tip the economy towards a recession. 

Sources: U.S. Bureau of Economic Analysis, FRED, and U.S. Bureau of Labor Statistics Note: RS and LS refer to the right and left series in the chart

Labor Market in Q2

The labor market remains tight despite losing some steam through the second quarter. The economy added 1.7 million jobs year-to-date, and the unemployment rate is low at 3.6%. Of jobs lost at the height of the COVID pandemic, it is estimated that more than 90% of jobs have been regained.¹ Average hourly earnings growth remains strong at 4.4% in June, which could support consumer spending if inflation falls meaningfully. Continuing unemployment claims are low, and the rate of job cuts is declining. However, after reaching a narrow gap earlier this year, the unemployment rate for Black workers increased to 6% while unemployment rates for white workers fell to 3.1%. Historically, Black workers have frequently been the first impacted by increasing unemployment.2 This widening gap in inequality can be an indicator of higher unemployment across the economy.

Inflation in Q2

​​Inflation, as measured by Headline Consumer Price Index (CPI), moderated to 3% in June 2023, down significantly from the peak of 9.1% in June 2022. The Federal Reserve prefers Core CPI, which excludes the volatile food and energy segments, dipped to 4.8% from 5.9% over the same period. While core CPI remains above the Fed’s 2% target, with shelter driving the year-over-year increase, leading indicators of market rents have been predicting a drop in shelter inflation. Most CPI items rose less than 2% on a three-month annualized basis in June. 

Stock Market Returns and Concentration Risk

The S&P 500 entered a new bull market in June as it went up more than 20% from its October 2022 low. US large cap stocks and international developed markets gained the most in the quarter, with all categories of risk assets positive in the quarter. In the bond market, expectations of further rate hikes by the Fed – despite slowing inflation – sent corporate and municipal bond markets lower.

For several quarters, we have been writing about the growing concentration in the S&P 500. The top 10 companies now make up over 28% of the index, with the remaining 490 stocks combining for the other 72%. Seven of these largest US companies, which many news outlets are calling the “Magnificent Seven” – Apple, Microsoft, Alphabet, Amazon, Nvidia, Tesla, and Meta – contributed 64% of the gains. 

Technology, Consumer Discretionary, and Communication Services sectors were the best performers in Q2 and year-to-date 2023. These sectors benefited from the rally of the “Magnificent Seven,” on the back of the market’s fascination with the potential of generative Artificial Intelligence. Performance was strong in most sectors despite the headwinds of expectations for further rate hikes by the Fed, which could negatively impact stocks. Nvidia was up 189% year-to-date. Apple hit a $3 trillion market capitalization milestone in Q2 and has over 7% weight in the S&P 500. 

A US stock market with very concentrated sources of return can pose risks or opportunities to investors who use environmental, social, and governance criteria in building their portfolios. If their ESG criteria excludes or underweights some of the magnificent seven, it is likely these exclusions posed a headwind for the investor in the second quarter. These same inclusions may benefit ESG portfolios if some of the market enthusiasm for these concentrated index positions wanes in future quarters.

Recent US Supreme Court Decisions Signal That Impact Investments are Needed More than Ever 

Many in the Veris community hold strong objections to decisions of the US Supreme Court over the last 14 months. Several of those decisions directly conflict with our impact focuses including climate change mitigation, community wealth building, advancing racial and gender equity, and sustainable and regenerative agriculture. These include restrictions to reproductive freedom, reduced protections against discrimination for LGBTQ+ people, reinforcement of longstanding barriers to higher education through the abolishment of affirmative action, and limits on government enforcement of environmental protections. Some of these interventions pose additional risks to the growth of our economy.

Student Debt Relief Decision

In June, the Supreme Court ruled that the Biden plan to forgive portions of student debt is unconstitutional. Outstanding student debt owed to the US government has an estimated value of $1.7 trillion or over 6% of the US GDP.3 In 2019, prior to the temporary relief from student loan payments implemented during the pandemic, annual payments on these loans exceeded $70 billion. Studies of older student debt relief programs suggest that debt relief benefited people with a range of outcomes including more flexibility to seek better employment opportunities that might require relocation and greater opportunities to get married or have children.4 This relief joined a collection of other government benefits introduced during the last 6 years that significantly increased the ability of individuals to spend money on goods and services, which has supported economic growth despite expectations of a recession in 2023. 

Tax cuts introduced in 2017 (that are scheduled to expire at the end of 2025), direct COVID related stimulus to taxpayers in 2020 and 2021, and benefits to a large portion of Americans through COVID emergency student loan relief along with a promise of significant loan forgiveness have all contributed to high consumer spending. Each of these economic stimulants, collectively increasing funds available to individuals by an amount exceeding 5% of annual GDP.5 Continued GDP growth since the beginning of the COVID pandemic has been largely attributed to consumer spending, reinforced by each of these tax reductions, rebates, and debt relief. While extension or expiration of tax cuts are in the hands of congress, removal of student debt relief as decided by the Supreme Court, are likely to impair spending and decision making for workers with student debt. According to the Federal Reserve, Black and Hispanic borrowers are more likely to be behind on their student loans payments than white borrowers and the student loan repayment relief helped improve their repayment status.6

Decision to End Affirmative Action

We believe that the Supreme Court’s decision to end affirmative action for college admissions highlights the need for investments in excluded communities and investments geared to reduce biases and disrupt the economic implications of long-standing structural racism. 

EPA Decision and Climate Change

Recent high temperatures across much of the US have long term economic implications, also impaired by the 2022 Supreme Court decision in West Virginia vs the Environmental Protection Agency (EPA). This decision prevents the government from intervening to shift energy creation from coal and other carbon intensive sources to clean energy sources,7 a move necessary to limit climate change. 

Meanwhile, June of 2022 was the hottest June on earth.8 In addition to catastrophic threats to life from this type of heat, there are economic implications. Extreme heat events limit economic activity through reducing consumer spending on travel and outdoor events.9 It also reduces the productivity of workers who work outside. In the US, an estimated 32 million workers spend a significant portion of their time working outside.10 

During extreme heat, workers must take additional breaks to hydrate and reduce body temperatures or they face potential life-threatening health events. A global study conducted from 1992 to 2013 estimated extreme heat to impair GDPs of high-income regions by 1.5% and to reduce GDPs of low income regions by 6.7%.11 With heat in recent years much higher than the periods of this study, the cumulative expense of neglecting climate change has likely only grown.

We believe the current restrictive stance of the Supreme Court offers several calls to action for impact investors. Despite EPA constraints on protecting the environment, clean energy jobs grew in all 50 states in 2022.12 Private and public investment in recent decades have led to technology improvements and economies of scale so that wind and solar projects are now cheaper sources of energy than coal, gas, and oil.13 

A Note of Gratitude to Our Clients

With our dual mission of helping clients have a positive impact with their investments while meeting their financial goals, Veris again is grateful to our clients for their dedication to this mission. The return to a bull market is a perfect opportunity to reassess spending goals and be sure that spending plans are protected in your portfolio. We are proud and honored to do this work with you.

Jane Swan is a Partner & Senior Wealth Manager at Veris Wealth Partners and a Chartered Financial Analyst (CFA®). Read Jane Swan’s Full Bio.

Roraj Pradhananga is a Partner & Managing Director of Research at Veris Wealth Partners and a Certified Public Accountant (CPA). Read Roraj Pradhananga’s Full Bio.

References

1 https://www.nytimes.com/interactive/2022/03/11/us/how-covid-stimulus-money-was-spent.html

2 https://www.bloomberg.com/news/articles/2023-07-07/us-black-workers-account-for-90-of-recent-unemployment-increase#xj4y7vzkg

3 https://slate.com/business/2021/03/student-loan-total-annual-government-payments.html

4 The Value of Student Debt Relief and the Role of Administrative Barriers: Evidence from the Teacher Loan Forgiveness Program Brian Jacob, Damon Jones, and Benjamin J. Keys NBER Working Paper No. 31359 June 2023

5 https://www.brookings.edu/articles/did-the-2017-tax-cut-the-tax-cuts-and-jobs-act-pay-for-itself/ ; https://www.bea.gov/news/2020/gross-domestic-product-fourth-quarter-and-year-2019-advance-estimate ; https://www.nytimes.com/interactive/2022/03/11/us/how-covid-stimulus-money-was-spent.html

6 https://www.federalreserve.gov/publications/2022-economic-well-being-of-us-households-in-2021-student-loans.htm

7 https://www.nrdc.org/stories/supreme-courts-epa-ruling-explained

8 https://www.pbs.org/newshour/science/summer-of-record-breaking-heat-paints-story-of-a-warming-world-scientists-say

9 https://www.nytimes.com/2023/07/18/business/extreme-heat-economy.html 

10 https://www.nytimes.com/2023/07/18/business/extreme-heat-economy.html

11 https://www.science.org/doi/10.1126/sciadv.add3726

12 https://www.energy.gov/articles/doe-report-finds-clean-energy-jobs-grew-every-state-2022

13 https://ourworldindata.org/cheap-renewables-growth

Disclaimer

The information contained herein is provided for informational purposes only and should not be construed as the provision of personalized investment advice, or an offer to sell or the solicitation of any offer to buy any securities. Rather, the contents including, without limitation, any forecasts and projections, simply reflect the opinions and views of the authors.

All expressions of opinion reflect the judgment of the authors as of the date of publication and are subject to change without notice. There is no guarantee that the views and opinions expressed herein will come to pass. Additionally, this document contains information derived from third party sources. Although we believe these third-party sources to be reliable, we make no representations as to the accuracy or completeness of any information derived from such third party sources and take no responsibility therefore. Information related to the performance of certain benchmark indices is provided for illustrative purposes only as investors cannot invest directly in an index. Past performance is not indicative of or a guarantee of future results. Investing involves risk, including the potential loss of all amounts invested.