Impact Focus Q3 2023: Inflation, Interest Rates, and Corporate Profits
By Jane Swan, CFA
In the hours approaching the end of the third quarter of 2023, Congress passed a bipartisan 45-day funding bill, temporarily preventing a government shutdown. At the time, President Biden prematurely expressed optimism for continuing engagement with Speaker McCarthy in a bipartisan process to approve a budget, including ongoing aid to Ukraine.1 Within two days, Representative Gaetz of Florida began the process of removing McCarthy as Speaker. That effort succeeded on October 3rd. The need to organize new leadership and pass a budget was eclipsed by the humanitarian crisis in Israel and Gaza.
Three weeks and three failed speaker candidates later, the Republican House majority elected far-right Republican Mike Johnson. Mike Johnson supported and played a key role in former President Trump’s effort to undermine the results of the 2020 election. The new Speaker could drive further uncertainty in policymaking as bipartisanship will be further out of reach.
The need for leadership and the importance of passing a budget is crucial for maintaining a stable economy and providing financial, humanitarian, and diplomatic support to Ukraine and now also in the Middle East. Additionally, inflation continues to infuse the economy, markets, and consumers with increasing uncertainty.
In this impact-focused review of Q3 2023, we will pay close attention to the relationships between income inequality, inflation, and corporate profits. You can read our overview of economic and market activity in Q3 here.
For several reasons, inflation has a greater impact on low-income, low-wealth families than those with higher incomes or high wealth. Non-discretionary items like food, housing, and fuel tend to make up a higher percentage of their household spending.2 Families with more financial privileges can cope with inflation through prudent choices, such as buying generic rather than luxury brands, reducing travel and restaurant consumption, as well as limiting retail choices.3 Over the last 20 months, the Federal Reserve (The Fed) has aggressively raised interest rates, making 11 hikes for a total increase of 5%. In doing so, Fed officials have often cited the disproportionate impact inflation has on low-income families.4
However, when we look at how inflation hurts low-income families, interest rate hikes frame a scenario where the cure is potentially worse than the disease. When interest rate hikes discourage spending, the result can be an increase in unemployment. This harms workers who lose jobs, as well as the ability for employed people to demand higher wages.5 Historically, women and Black workers have faced the greatest obstacles to employment in periods of high unemployment.6
The negative impact for low-income families goes beyond potential employment risks.
The bottom 80% of households have depleted most of their excess savings and are taking on more debt.7 Default rates on auto loans are higher now than at any point in recorded history.8 Borrowers with high credit scores may feel current new car loan rates around 5% are high, but that pales in comparison to rates over 14% which are paid by people with low credit scores through subprime loans, which were one of the reasons for the housing market crash in 2007 and 2008.9 The ongoing high interest rates impact low-income households through obvious consequences like interest charges on credit card debt. Additionally, higher interest rates make home ownership even more unattainable to low-income borrowers with less available for down payments, requiring them to finance a higher percentage of home purchases.10 The link between the wealth gap and homeownership is examined in our DEIB Investing report, published this fall.
Looking at income by decile 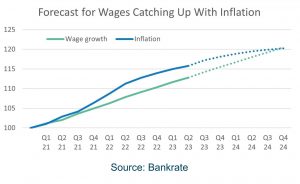 (5 groups, each representing 20% of income groups) we see that while income has been relatively flat for the bottom 60% of income earners, it has grown steadily for those between 61 and 80%, and sharply for the top 20% of income earners.11
Suppressed wage growth for lower earners over recent decades makes these populations simultaneously vulnerable to inflation and high interest rates. While wage growth on average has been higher through the COVID recovery and high inflation period, it is estimated that it will take another year for those wage hikes to make up for the negative income effect of inflation.
As The Fed works to combat inflation, we believe it is important to examine how prices are set, and some potential causes of inflation. A producer of goods and services usually sets a price based on the costs of production (including labor) and marks up the price to add a profit. If they include too much profit in the price, consumers may look for substitute goods. If consumers choose substitute goods, the producer may decide to reduce the profit from each unit sold to attract more consumers. This is the supply/demand relationship. When wage increases lead to increases in prices and higher inflation, workers are likely to demand even higher wages. This is known as the wage-price spiral.
At the first signs of inflation in 2021, The Fed and many analysts expected that the inflation was “transitory” or temporary.12 Supply chain and a tight labor market were seen as temporary problems that would resolve with remedies to supply-chain constraints and stabilization of the tight labor market.13 As high inflation has persisted beyond the period of significant supply chain constraints and as wages have grown less than inflation, analysis in 2023 has increasingly included examination of increasing corporate profits as a significant contributor to inflation. In February of 2023, The Fed was pointing to signs that the wage growth was moderating and began to shift some focus to what they called “The wage-price spiral.”14
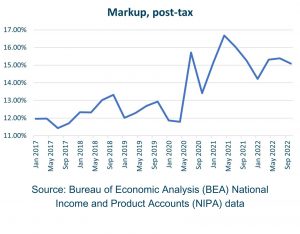
The “Mark Up” in prices, which increased during and after COVID has protected corporate earnings while contributing to inflation.15
From 2020 to 2022, non-labor cost changes as a component of increasing prices stayed about the same as they were from 2007-2019, changing from 28.6% pre-COVID to 32.3% during and after COVID. Comparing these same time periods, unit labor costs as a component of increasing prices actually went down from 58.4% to 32.8% during and after COVID.
The biggest change in contributions to i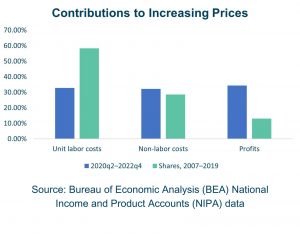 ncreasing prices came from profits, which were 13.1% of contributions to increasing prices before the pandemic but have been 34.4% of contributions to profits in the years that followed.
Unless corporations reduce prices to reflect improving supply chains and lower prices of inputs, low-income families will not benefit from real wage growth as the rate of inflation subsides. Otherwise, the only beneficiaries are owners and shareholders of these companies.
All investors, including impact investors, benefit from and are protected by increasing prices. Some impact investors attempt to distinguish ourselves by examining these relationships and exploring and including alternate investments which aim to remedy some of the externalities in our financial systems. Notes in Community Development Financial Institutions (CDFIs) and CDs with Credit Unions can reduce the negative impact of high interest rates on low-income communities by offering subsidized or low-interest loans to borrowers often excluded from traditional bank loans. Some impact investors make investments in companies that seek to remedy inequities in how credit scores ratings are set, taking action towards leveling the playing field.
For more information on impact solutions to the problems of inflation and high interest rates, please see our DEIB Investing Report or speak to your advisor.