Veris Economic and Market Update Q3 2023
By Jane Swan, CFA and Roraj Pradhananga, CPA
The first quarter of 2023 was characterized by major events such as the failure of Silicon Valley Bank, escalating concern of a pending recession. Sentiment made an about face in the second quarter, buoyed by limitless enthusiasm for artificial intelligence. At the end of the third quarter, we seemed to have settled into an uncomfortable normalcy: uncertainty.
The labor market remains tight despite slowing job growth in 2023. The unemployment rate remains low at 3.8% despite increasing 0.2% in Q3.¹ Employees are losing confidence in their job prospects, as shown by recent declines in the Conference Board survey and stalling of the quits rate.
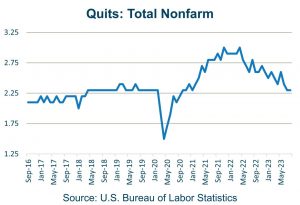 The quits rate, measuring the number of quits as a percentage of the employment, peaked in April of 2022 at 3%. In the third quarter it fell to 2.3%, equivalent to the rate in February of 2020. The fall in quits suggests workers are less certain they will easily find replacement jobs if leaving their current job.
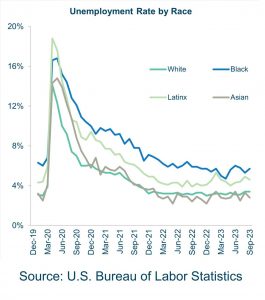 The unemployment rate for Black Americans dropped slightly to 5.7% from 6% in June, it remains elevated compared to white and Asian Americans.
The US economy remains tepid but resilient, supported by strong labor and housing markets. While growth remains positive, up 2.4% in the second quarter and preliminary estimates suggesting annualized growth accelerated to 4.9% in the third quarter, there are signs of slowing economic momentum.³
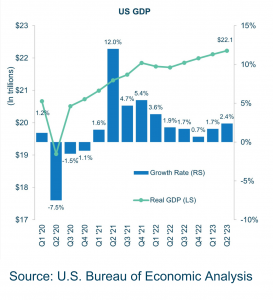 Consumer balance sheets remained strong, but the bottom 80% of households have depleted most of their excess savings and are taking on more debt.⁴ Default rates on auto loans are higher now than at any point in recorded history.⁵ Borrowers with high credit scores may feel current new car loan rates around 5% are high, but that pales in comparison to rates over 14% which are paid by people with low credit scores.⁶ We believe the mounting debt strain on consumers, along with higher interest rates and energy prices, the uncertainty of potential government shutdown in November, and the forthcoming resumption of student loan payments, will weigh on consumer spending and economic growth. This is discussed further in our Quarterly Impact Focus report.
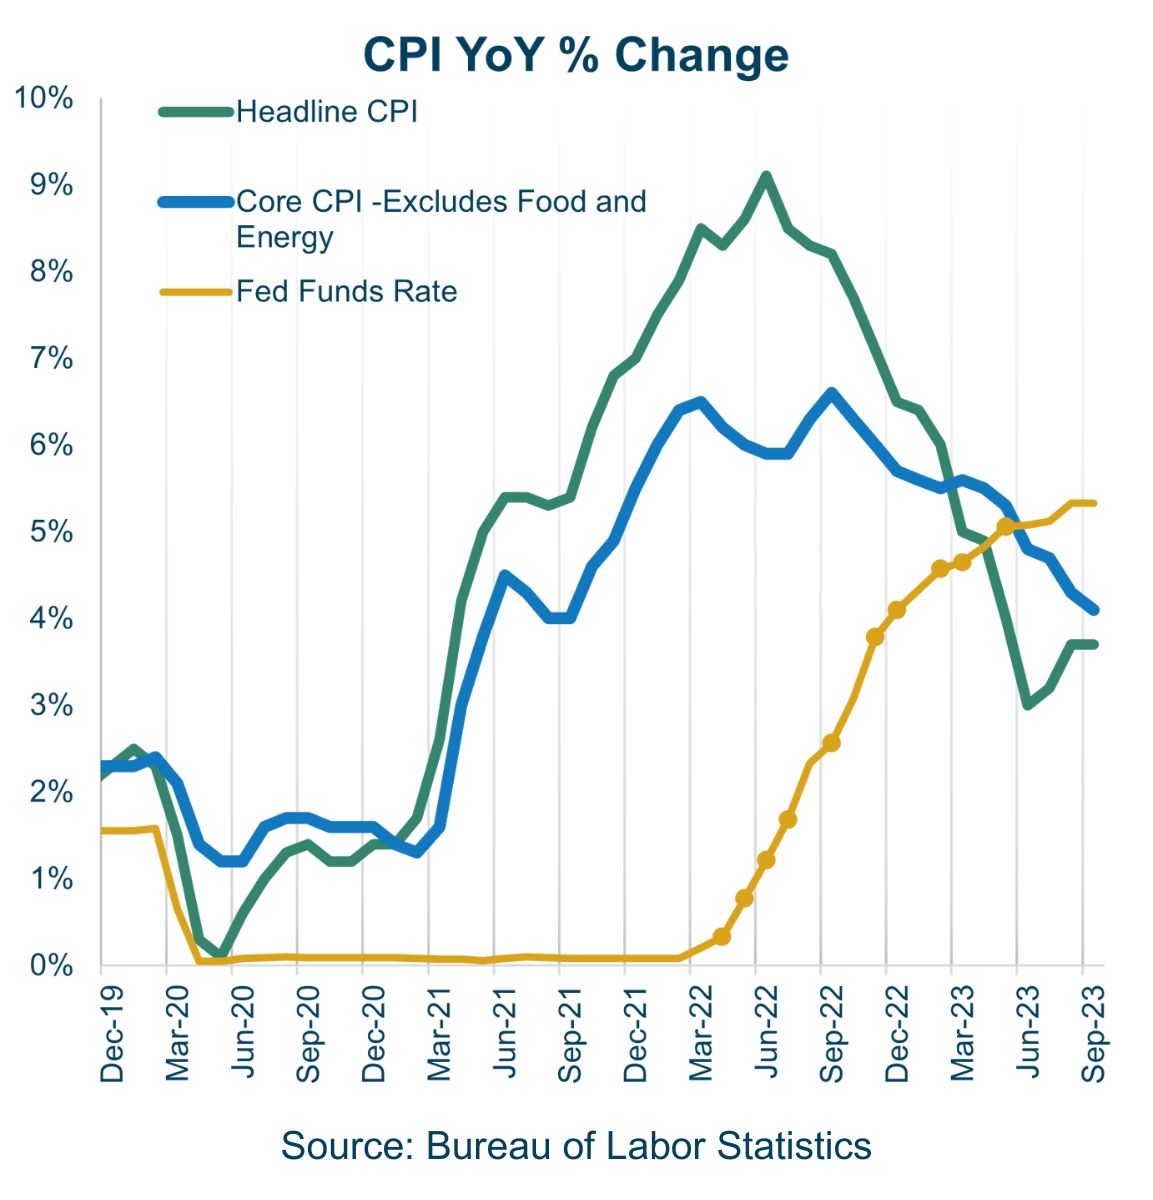
A sustained inflation downtrend has been in place since June 2022, when it peaked at 9.1%, falling to 3.7% in September.⁷
While core CPI remains abov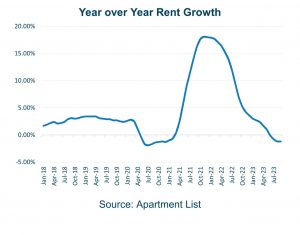 e the Fed’s 2% target, there are reversals in major categories that drove inflation higher in the last two years such as easing vehicle prices, reflective of improving supply chains. Shelter remains the main driver of increases in core CPI, but leading indicators are predicting lower shelter prices ahead.
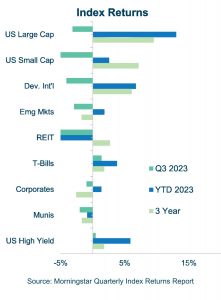 After strong gains in the first half of 2023, global equities posted a negative return in Q3.
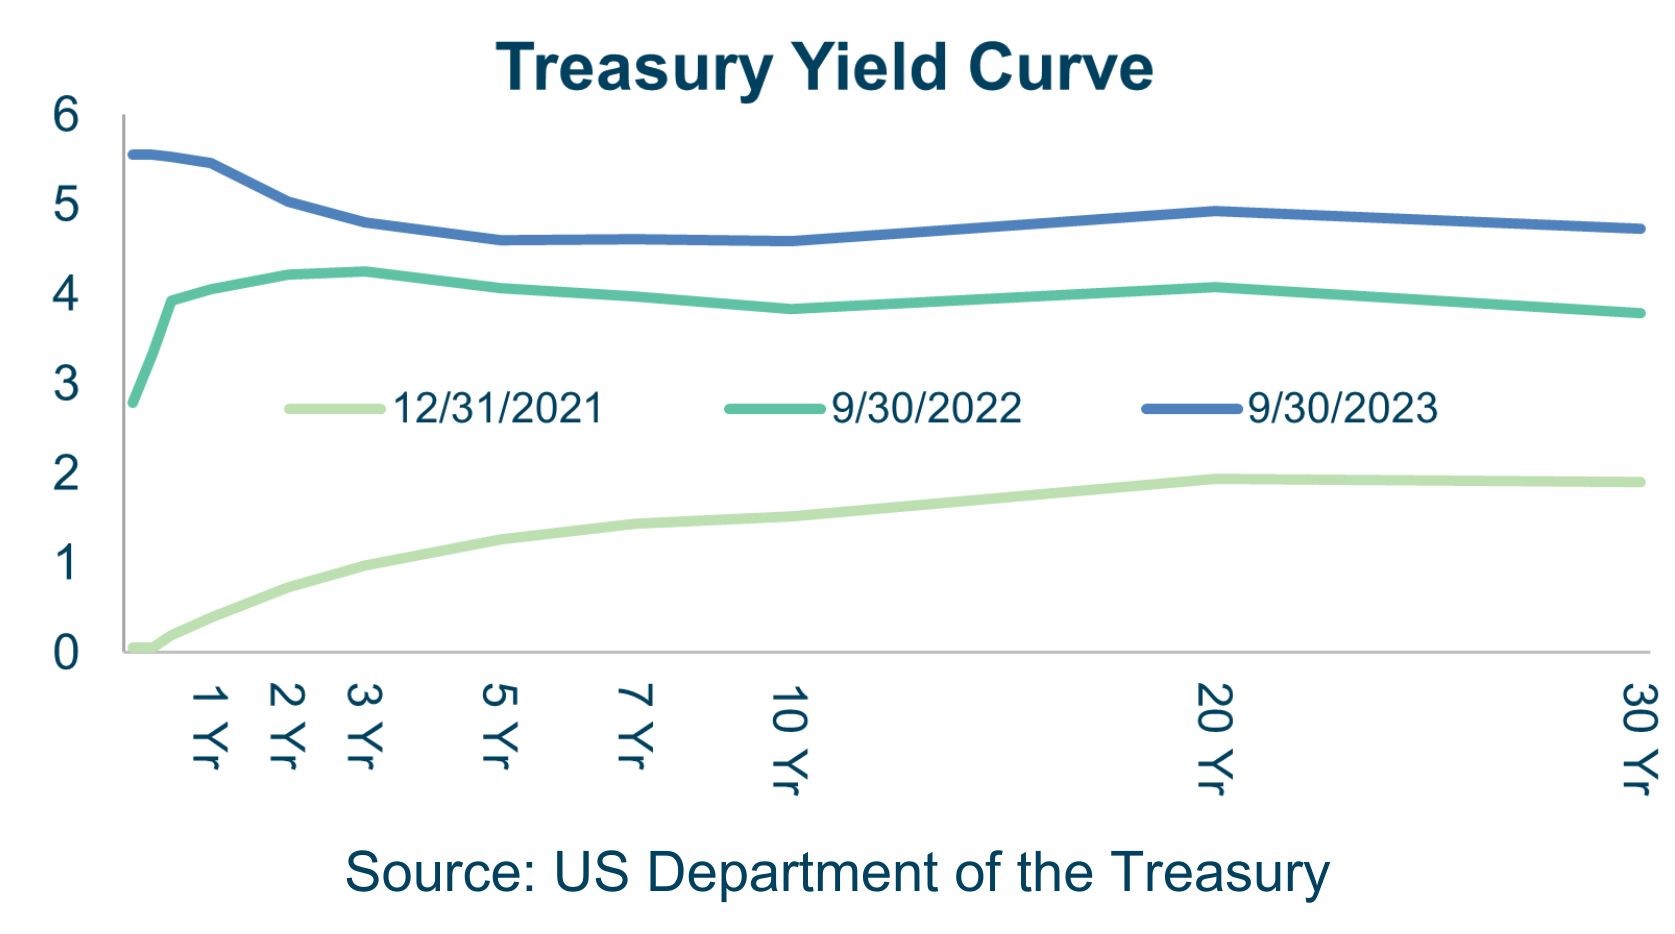
Most of the “Magnificent Seven” (Apple, Microsoft, Alphabet, Nvidia, Amazon, Meta, Tesla) declined in August and September, retreating from the perhaps over enthusiasm in Q2.⁸ Fed officials continued to convey higher rates would be needed for longer to contain higher than expected inflation.⁹ In response, US equities trended lower. Bond markets also mostly declined in Q3 as yields increased meaningfully.
Energy and Communications Services were the two sectors with a positive return during the third quarter, returning 12.2% and 3.1%, respectively.
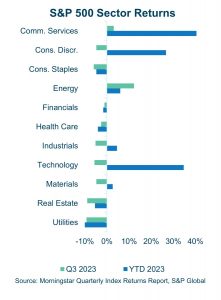 After leading performance in the first half of 2023, Information Technology declined 5.6%, with the reversal led by Apple, Microsoft, and Nvidia, followed by Tesla and Meta. The Energy sector continues to benefit amid oil production cuts from Saudi Arabia and Russia and the Israel-Hamas war.
Despite the headline grabbing 12.2% QTD and 51.2% 3-year returns, the Energy sector has trailed the other sectors on a risk-adjusted basis over 10 years.

The height of each point on this graph represents the average return of the sector over the last 10 years. The distance from left to right measures the volatility of each sector, with less volatile sectors to the left and more volatile sectors to the right. The graph shows that over this period, energy had both the lowest returns and the highest volatility, by a significant margin, of all sectors in the S&P 500. While the ongoing war in Ukraine and related reductions in oil and gas supply from Saudi Arabia and Russia add to short-term tailwinds in the sector, we believe significant long-term headwinds for the sector include declining costs of renewable energy, transmission and storage solutions.
The stock market ended the quarter 11% lower than the highs reached towards the end of 2021, which is 16% higher than lows we saw one year ago.¹¹ As of the time of this report, the uncertainty around the Israel-Hamas war and the potential government shutdown could lead to further volatility and downside risks to markets. Fragility in the stock market recovery, along with significant uncertainty from geopolitical events and our wildly volatile political paths ahead serve as a reminder to evaluate expected spending needs and to check cash reserves, in consultation with your Veris advisors.
Related reading: Impact Focus Q3 2023: Inflation, Interest Rates, and Corporate Profits
Authors
Jane Swan is a Partner & Senior Advisor at Veris Wealth Partners and a Chartered Financial Analyst (CFA®).
Roraj Pradhananga is a Partner & Managing Director of Research at Veris Wealth Partners and a Certified Public Accountant (CPA).
Sources
- www.bls.gov/news.release/laus.nr0.htm#:~:text=The%20national%20unemployment%20rate%2C%203.8,of%20Columbia%20in%20September%202023.
- U.S. Bureau of Labor Statistics, Quits: Total Nonfarm [JTSQUR], retrieved from FRED, Federal Reserve Bank of St. Louis; https://fred.stlouisfed.org/series/JTSQUR, October 20, 2023.
- https://research.stlouisfed.org/publications/economic-synopses/2023/10/10/modeling-professional-recession-forecasts
- www.bloomberg.com/news/articles/2023-09-25/only-richest-20-of-americans-still-have-excess-pandemic-savings
- www.bloomberg.com/news/articles/2023-10-21/high-car-loan-interest-rate-payments-americans-struggle-with-monthly-bills
- https://www.bankrate.com/loans/auto-loans/average-car-loan-interest-rates-by-credit-score/#average
- https://www.bls.gov/opub/ted/2023/consumer-prices-up-3-7-percent-from-september-2022-to-september-2023.htm
- Source: Morningstar
- www.bloomberg.com/news/articles/2023-09-20/fed-signals-higher-for-longer-rates-with-hikes-almost-finished
- US Department of the Treasury
- Source: Morningstar
Disclaimer
The information contained herein is provided for informational purposes only and should not be construed as the provision of personalized investment advice, or an offer to sell or the solicitation of any offer to buy any securities. Rather, the contents including, without limitation, any forecasts and projections, simply reflect the opinions and views of the authors.
All expressions of opinion reflect the judgment of the authors as of the date of publication and are subject to change without notice. There is no guarantee that the views and opinions expressed herein will come to pass. Additionally, this document contains information derived from third party sources. Although we believe these third-party sources to be reliable, we make no representations as to the accuracy or completeness of any information derived from such third party sources and take no responsibility therefore. Information related to the performance of certain benchmark indices is provided for illustrative purposes only as investors cannot invest directly in an index. Past performance is not indicative of or a guarantee of future results. Investing involves risk, including the potential loss of all amounts invested.


