Q2 2026 Economic and Market Review
When we wrote our Q1 economic and market update, the conflict between the United States and Iran was underway. There was great uncertainty about whether a deal would be made, yet optimism from markets that a swift conclusion would be found. Three months later, we are in much the same position. Many of us are exhausted by the contradictory messages and actions that keep coming out about the conflict and its potential humanitarian and economic implications. There has been a persistent lack of clarity and useful information coming out of Washington. In this letter, we hope to offer something more useful: a look at what actually happened in the economy during the second quarter, what the markets are telling us, and what it may mean for your portfolio as we head toward the fall.
Monetary Policy, Fiscal Policy, and the Question of Independence
The second quarter brought a change we have not seen in more than eight years: a new Chair of the Federal Reserve. Because Fed chair transitions are infrequent (chairs typically serve at least six years, and stability has historically been a major priority) this one deserves some context.
It helps to start with the difference between fiscal policy and monetary policy. Fiscal policy is the setting of the federal budget: the executive branch proposes the budget, and Congress writes and approves it. Decisions about deficits and where money is spent can encourage economic expansion or encourage tightening. Monetary policy, chiefly the setting of interest rates by the Federal Reserve based on a dual mandate of stable prices and maximum employment, has its own levers that can encourage expansion or contraction. The Federal Reserve is designed to be independent from the executive branch and markets have long valued that independence as a check against politically-motivated monetary policy.
What made this transition remarkable is the public and persistent efforts of the executive branch, led by President Trump, to gain greater influence over monetary policy. The President has publicly demanded lower interest rates and attempted to remove a sitting Fed Governor, Lisa Cook, which the courts have blocked. The appointment process appeared to function as a loyalty test, with the White House suggesting its nominee would treat the administration’s objectives favorably.
So far, it appears the markets don’t believe the Fed’s independence has been compromised. Despite this remarkable level of interference from the executive branch, the market is not pricing in any imminent rate cuts. And the new Chair’s own debut statement supported that view. At the June FOMC meeting and in his first press conference1, Chair Kevin Warsh made no mention of cutting rates as the Committee unanimously voted to hold the fed funds rate at 3.5-3.75%.2 Instead, he focused on a conventional message with a strong commitment to price stability, which seems to have reassured many market participants rather than unsettling them.
If anything, the committee’s outlook has leaned more hawkish (meaning more focused on combating inflation than on stimulating growth). Inflationary pressures resulting from the ongoing conflict in Iran support an increase in the fed funds rate, not a cut. The median Fed funds projection for 2026 rose to about 3.8%,3 and of the 18 FOMC participants, nine now expect at least one rate hike this year, while eight see rates as unchanged.
What the Yield Curve Is Telling Us
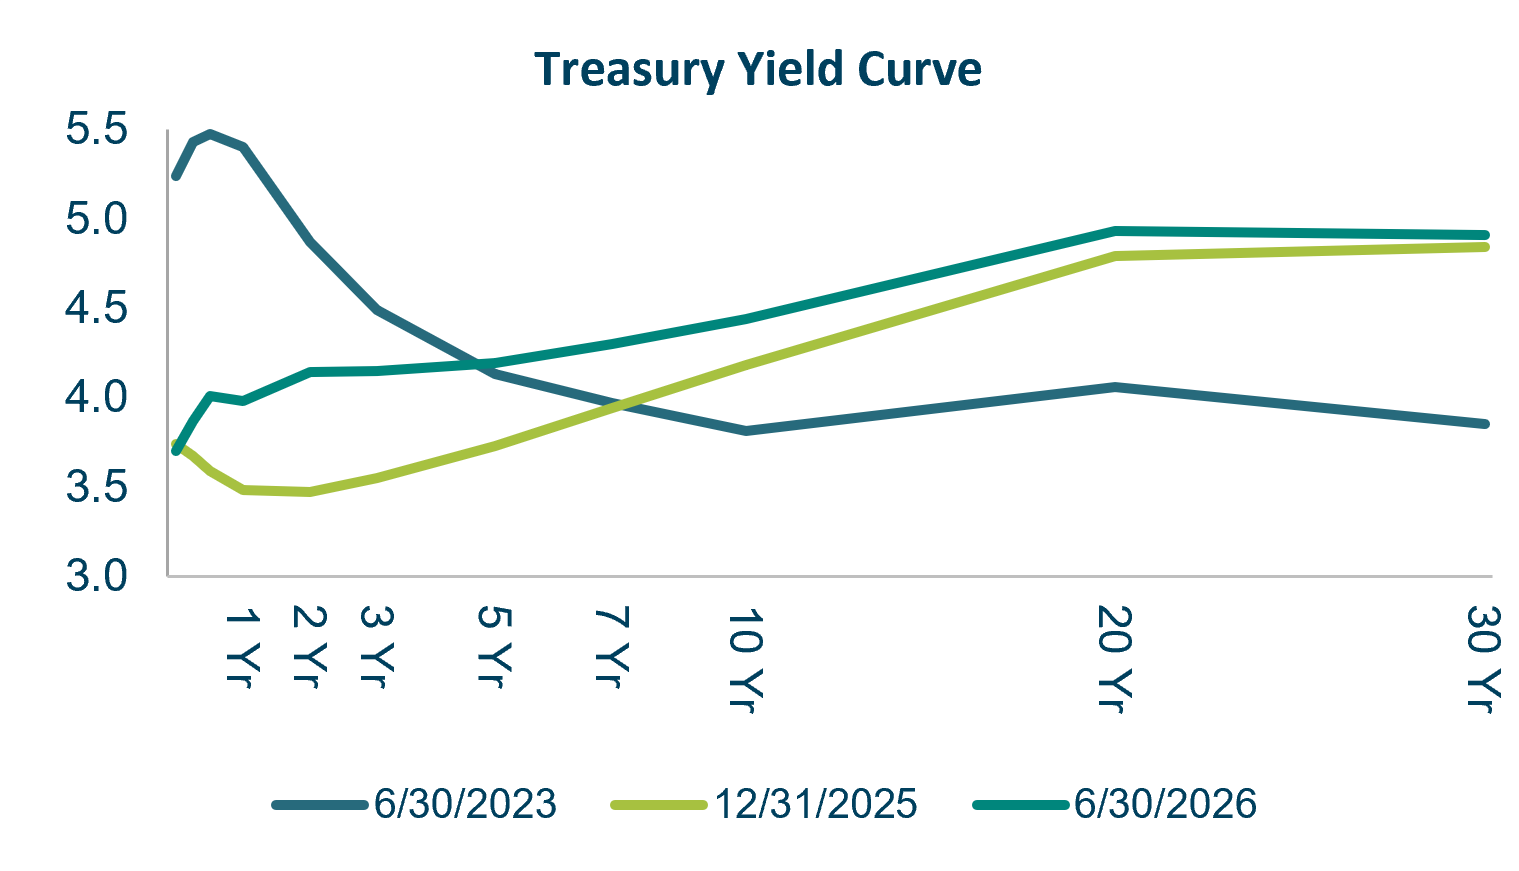
We believe one chart from this quarter tells the story better than anything else: the shifting shape of the Treasury yield curve.
Source: US Department of the Treasury 4
In 2023, the Fed raised interest rates to fight persistently high inflation. The fed funds rate (which is the overnight rate the Fed controls directly) then sat at 5.25%.5 But the longer end of the curve, which is set by market expectations rather than the Fed, sat well below that. Why would any investor accept less on a 10-year bond than on overnight money? This inverted yield curve signaled that investors believed that the Fed’s decision to raise rates would bring inflation down and expected rates to fall over the 10+ year horizon.
From that point in 2023, the Fed made six rate cuts lowering the front-end of the yield curve.6 As a result, the yield curve normalized and was no longer inverted by the end of 2025. More recently, the longer end of the yield curve (10 year+) moved up as markets demanded to be paid more for lending money over ten years on the expectations of tariffs driven inflation and continuously increasing deficit spending. By the end of the year, markets had adjusted to the volatility of tariffs and forecasts included three rate cuts in 2026.
Between December 31, 2025, and June 30 of 2026, the Fed did not cut rates. Renewed expectations of inflation erased the hopes of rate cuts. With no change to the fed funds rate, the yield curve except for the overnight rate shifted upwards and flattened. The shorter end of the curve moved up significantly on expectations of higher inflation due to the US/Iran conflict and the Fed potentially increasing rates. The longer end of the curve rose again, which we believe can be attributed to investors’ inflation and deficit concerns.
This is the disconnect worth understanding. The overnight rate is not what most households borrow at, but it’s the rate frequently referenced as the “fed funds rate.” Floating-rate lines of credit, which are used primarily by wealthy borrowers and corporations, move with the fed funds rate. Mortgages, car loans, and credit cards are far more closely tied to the 10-year Treasury, where inflation expectations are the bigger driver of borrowing costs. Bringing the overnight rate down does not bring those costs down for the average consumer in an inflationary environment. This is why coordination between fiscal policy and monetary policy, rather than conflict between them, matters so much for the real borrowing costs families and businesses actually face.
Economic Growth is Strong with Softening of Labor Market
The US economic growth held up better than early estimates in Q1 with annualized growth revised to +2.1%.7 Economic growth rate is expected to decelerate in Q2 as job creation slowed sharply and unemployment ticked down to 4.2% due to falling labor-force participation rate in June. However, economic data is still mostly positive with manufacturing and services activity that continues to expand. Consumer spending also held up with retail sales for May up 0.9% month over month, even after accounting for inflation.8
The United States’ economy also continues to stand out against the U.K., Germany, and other European and Asian economies, many of which have been affected by the US-Iran war far more directly. The US is now likely the world’s largest energy producer and a net exporter,9 while many of these economies rely on imported oil and gas. This difference shows up in both inflation and economic activity, and one we are clearly seeing from a performance perspective.
Markets Near Highs, Despite Everything
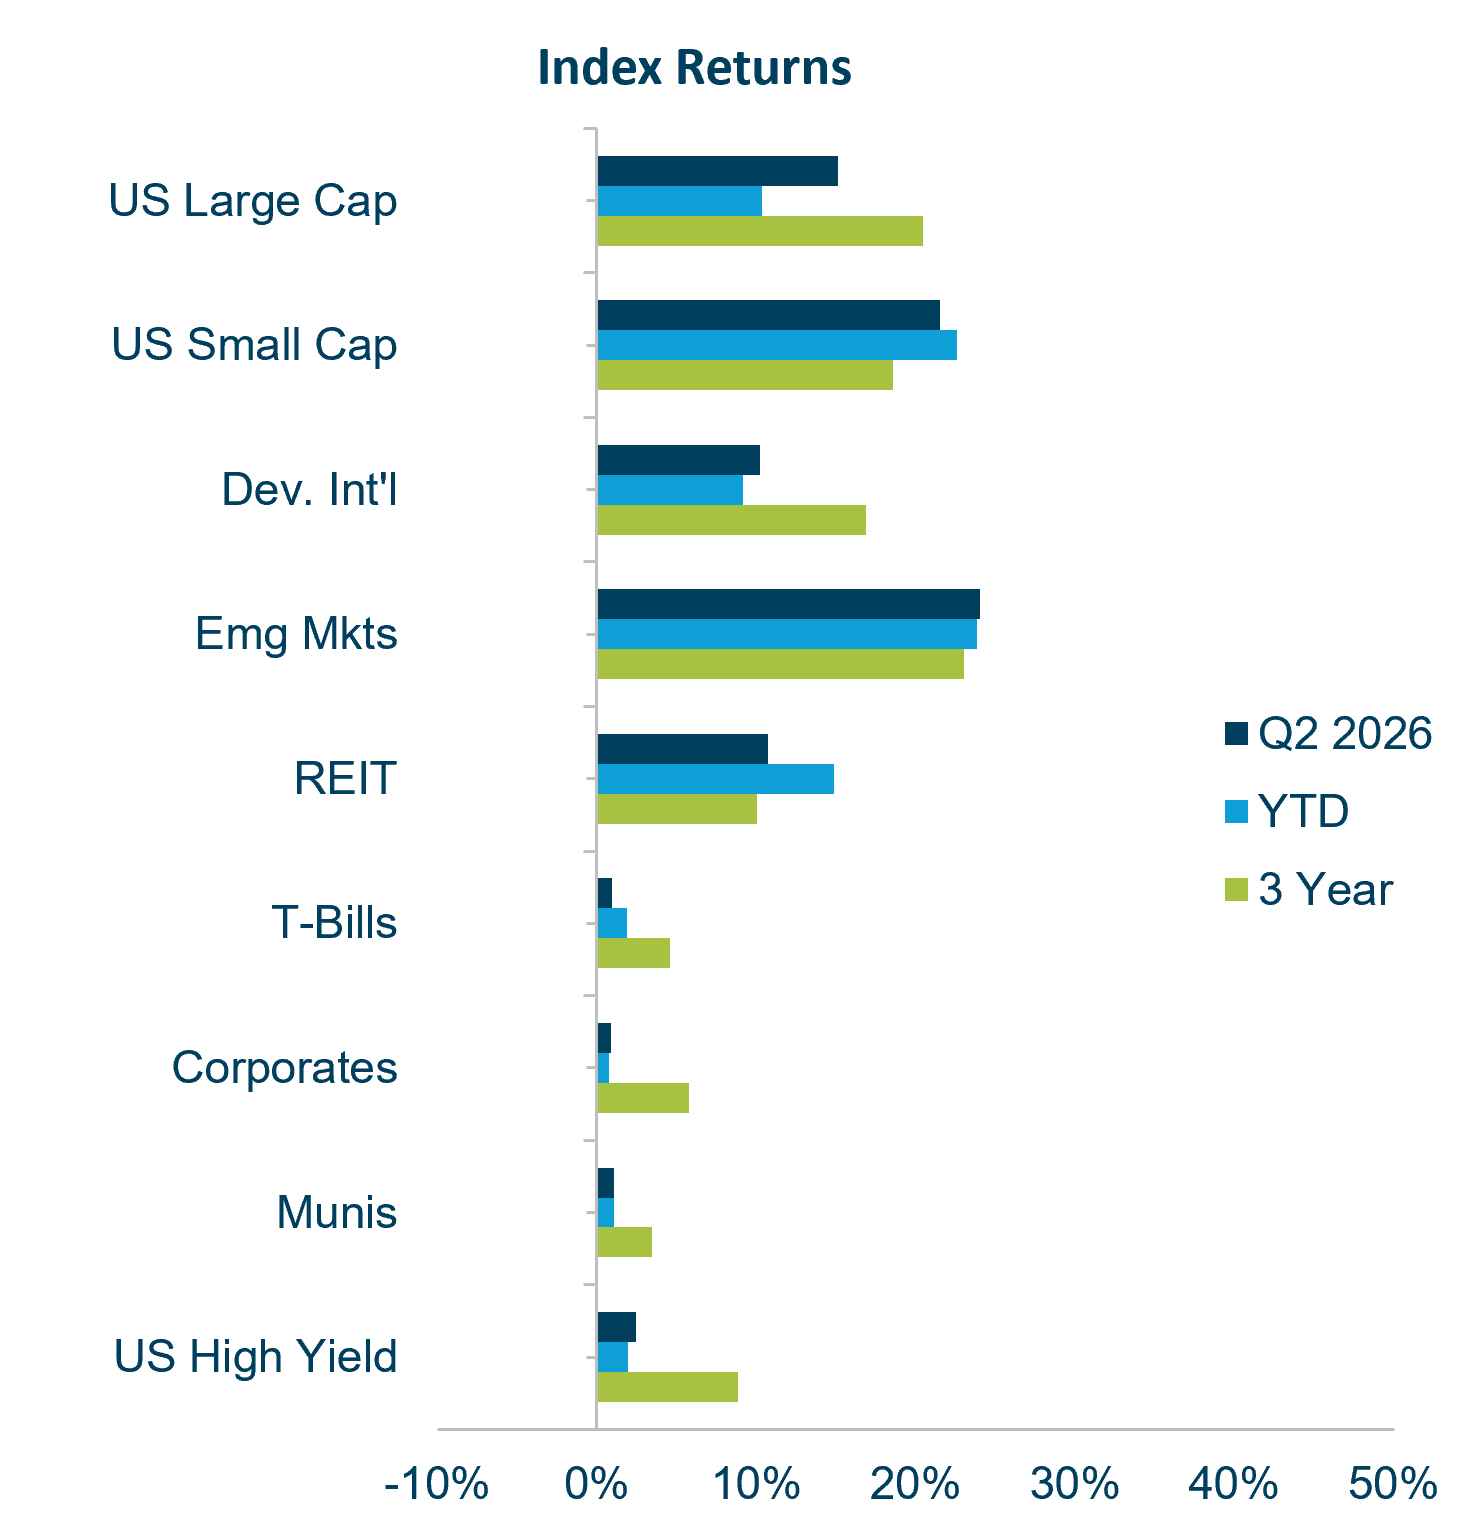
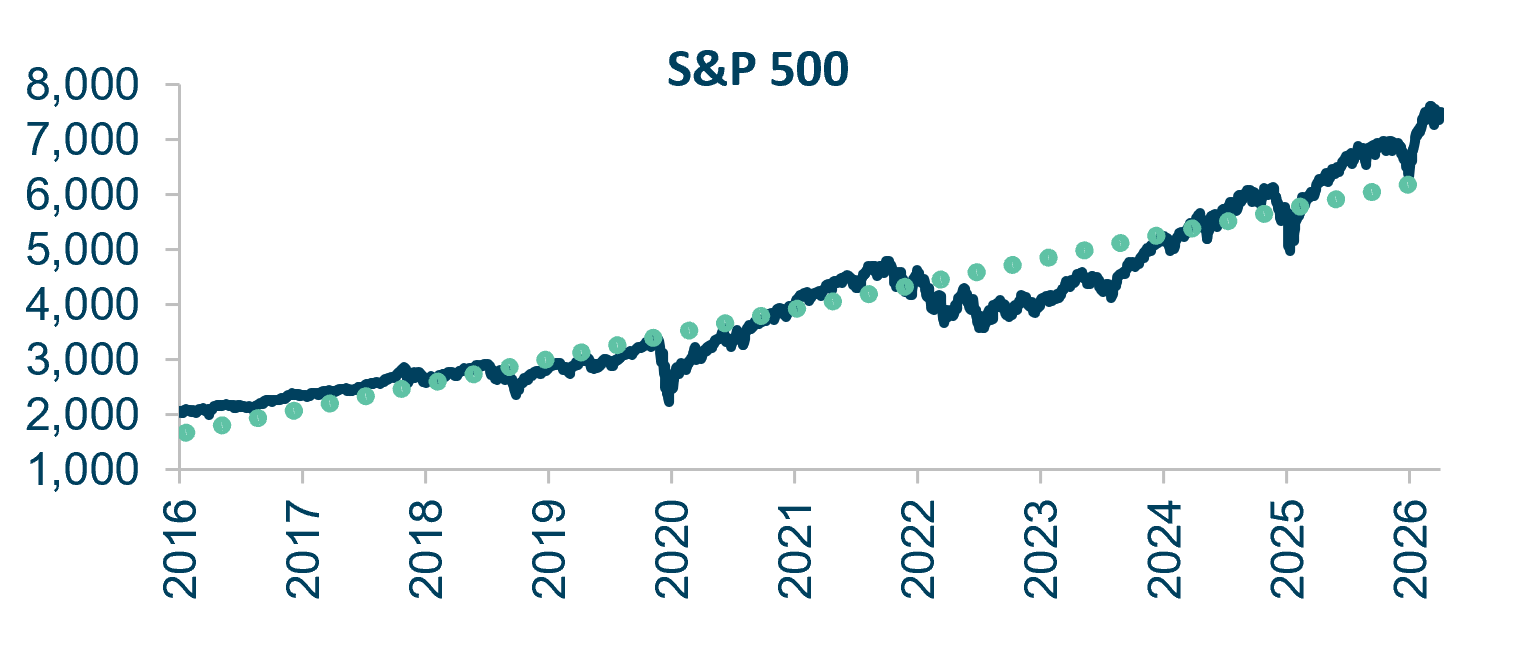
As of June 30, equity markets (including large and small cap indices and both developed and emerging markets) closed very near their all-time high.10 Historically, markets have been uneasy in periods of uncertainty.11 More recently markets have shown a largely persistent disregard for uncertainty. After a brief decline in the first weeks of the conflict in Iran, markets have rebounded and continued to climb despite repeated violations of the peace agreement. Markets hiccupped in response to the “Liberation Day” tariffs but have since largely ignored the possibility of ongoing trade barriers. The markets appear to be threading the needle into an optimistic reality, apparently acting on optimistic assumptions that best case scenarios (among a mixed variety of potential outcomes) are likely.
The equity market performance hasn’t been driven by optimism alone, the strength has been supported by earnings: revenue and earnings growth have been strong, and the consumer is still spending. Q1 earnings season was very strong with the S&P 500’s earnings growth of 28.6% year-over-year,12 which was well above the 13% expectation. Q1 earnings growth was the highest since Q4 2021.13 Technology continues to lead the earnings growth. Expectations for Q2 earnings season remain positive against strong economic conditions and continued AI investments.
Sources: eVestment, FRED15
Technology sector concentration is now rising in emerging markets as a result. The S&P 500, led by semiconductor and AI infrastructure names, posted its best quarter since 2020.
Source: eVestment 16
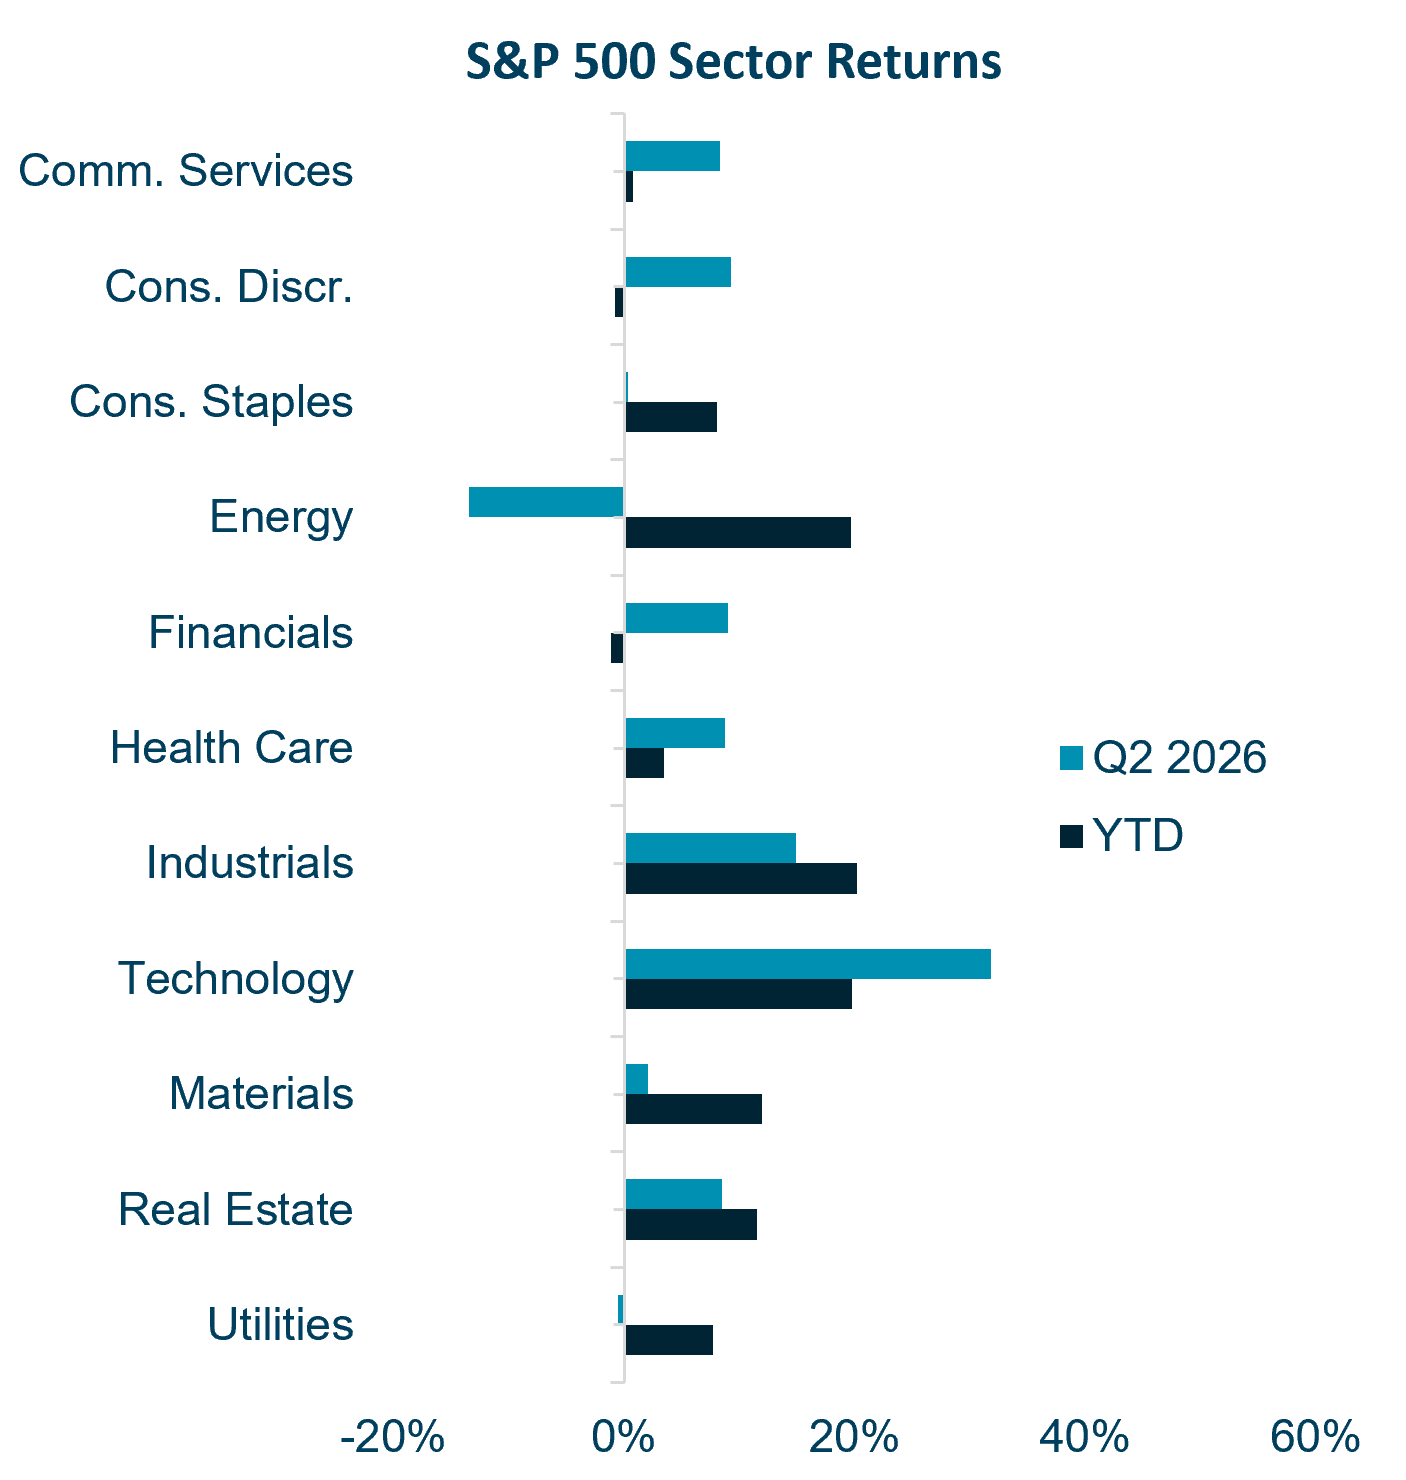
Energy pulled back from Q1 highs and ended as the worst performing sector of Q2, while remaining one of the top performing sectors on a 1-year basis.17 The standout performer of Q2 was Technology, surging 31.8%, by far the sector’s strongest quarter of the current cycle and a complete reversal of its 9.1% Q1 decline.
Sources: eVestment, S&P Global, MSCI 18
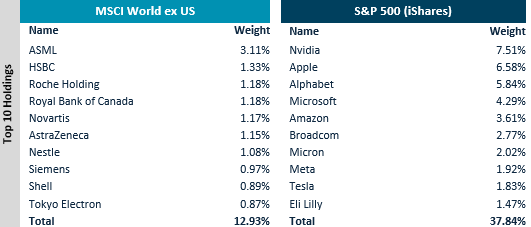
The nine largest names in the S&P 500 are all AI-related technology or tech-adjacent companies (the tenth, Eli Lilly, is a pharmaceutical company with a blockbuster weight-loss drug).
Sources: S&P Global, MSCI 19
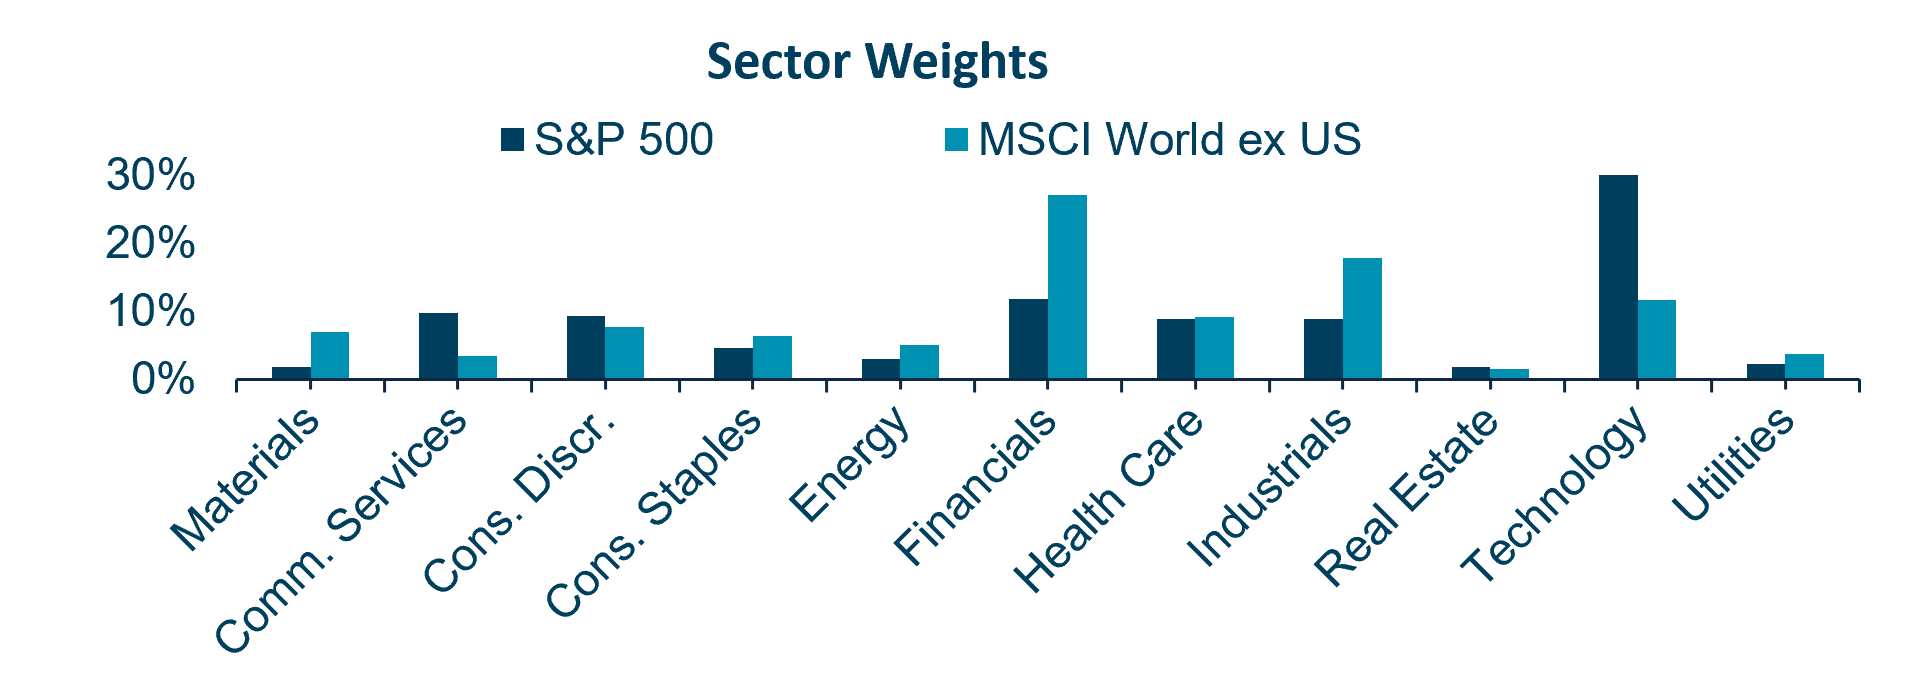
Together the top 10 make up 37.84% of the benchmark.20 That is actually down from 43% six months ago, but the mix is more tilted to technology than before, as JPMorgan and Berkshire Hathaway have dropped out of the top 10 to make room for Eli Lily and chipmaker Micron. Compare that with the MSCI World ex-US index, where the top 10 names span technology, financials, healthcare, consumer staples, industrials, and energy and make up just 13% of the index. Diversification still exists; you just have to look beyond the S&P 500 to find it.
Sources: eVestment, S&P Global, MSCI 21
Looking Ahead: Markets and the Midterms
Americans are beginning to think about the midterm elections in more concrete terms, and many of our clients are asking how the political ramifications of the ongoing conflict, especially the fluctuating cost of oil, which consumers feel directly at the gas pump — may reposition the two major parties this fall.
Markets historically tend to pause going into midterms,22 not wanting to overcommit ahead of potential changes in policy, budgeting, and spending. This cycle carries an additional variable: Congress has been notably disinterested in asserting its authority over the past year and a half. If that changes with a new Congress (through shifts in the regulatory environment, or investigations into conflicts of interest) it could reshape the earnings environment that is currently contributing to the market’s strength.
What This Means for Your Portfolio
Three factors are likely to continue driving volatility in the months ahead: the conflict in Iran, inflation, and the enormous capital investment flowing into AI. On that last point, one number worth watching: technology companies have raised roughly $1 trillion in the public fixed income market to finance AI spending (about 14% of the investment grade market) meaning the concentration we have seen in public equities may be emerging in public fixed income as well.
With markets near all-time highs, now is the time to prepare. For clients with spending needs on the horizon, this is an opportunity to raise cash from appreciated securities and be well positioned should we enter a phase where markets begin to better incorporate the vast uncertainties of today. Highs in the market are not a reason for alarm — but they are a gift to the prepared. Your advisory team is ready to talk through what this means for your own plans.
As always, we welcome your questions.
Authors
Jane Swan is a Partner, Senior Advisor, and Chief Advisory Officer at Veris, and she holds the Chartered Financial Analyst (CFA®) designation. Bio.
Roraj Pradhananga is a Partner and Chief Investment Officer at Veris and a Certified Investment Management Analyst (CIMA®) and Certified Public Accountant (CPA). Bio.
Disclaimer
The information contained herein is provided for informational purposes only and should not be construed as the provision of personalized investment advice, or an offer to sell or the solicitation of any offer to buy any securities. Rather, the contents including, without limitation, any forecasts and projections, simply reflect the opinions and views of the authors. All expressions of opinion reflect the judgment of the authors as of the date of publication and are subject to change without notice. There is no guarantee that the views and opinions expressed herein will come to pass. Additionally, this document contains information derived from third party sources. Although we believe these third–party sources to be reliable, we make no representations as to the accuracy or completeness of any information derived from such third-party sources and take no responsibility, therefore. Information related to the performance of certain benchmark indices is provided for illustrative purposes only as investors cannot invest directly in an index. Past performance is not indicative of or a guarantee of future results. Investing involves risk, including the potential loss of all amounts invested. The information contained in this document also contains certain forward-looking statements, often characterized by words such as “believes,” “anticipates,” “could,” “plans,” “expects,” “projects,” and other similar words that indicate future possibilities. Due to known and unknown risks, other uncertainties and factors, actual results may differ materially from the expectations portrayed in such forward-looking statements.
Sources
1. https://www.federalreserve.gov/mediacenter/files/FOMCpresconf20260617.pdf
2. https://www.federalreserve.gov/newsevents/pressreleases/monetary20260617a.htm
3. https://www.federalreserve.gov/monetarypolicy/files/fomcprojtabl20260617.pdf
4. US Department of the Treasury
5. https://www.forbes.com/advisor/investing/fed-funds-rate-history-1/
6. https://www.forbes.com/advisor/investing/fed-funds-rate-history-1/
7. https://www.bea.gov/news/2026/gdp-third-estimate-industries-corporate-profits-state-gdp-and-state-personal-income-1st
8. https://www.census.gov/retail/sales.html
9. https://www.eia.gov/energyexplained/us-energy-facts/imports-and-exports.php
10. https://www.cnbc.com/2026/06/29/stock-market-today-live-updates.html
11. https://www.morningstar.com/economy/what-weve-learned-150-years-stock-market-crashes
12. https://advantage.factset.com/hubfs/Website/Resources%20Section/Research%20Desk/Earnings%20Insight/EarningsInsight_052926A.pdf?hsCtaTracking=31d0f488-5c02-4193-b93b-f1708067f4fa%7Cb994622e-6b82-4c98-ad34-76c848088314
13. https://www.ishares.com/us/insights/inside-the-market/market-trends
14. eVestment, FRED
15. eVestment, FRED
16. eVestment
17. eVestment, S&P Global,
18. eVestment, S&P Global, MSCI
19. S&P Global, MSCI
20. S&P Global
21. eVestment, S&P Global, MSCI
22. https://www.usbank.com/investing/financial-perspectives/market-news/stock-market-performance-after-midterm-elections.html