
Economic & Market Update: Q1 2025
By Jane Swan, CFA and Roraj Pradhananga, CIMA & CPA
The global economic landscape has shifted at a dizzying pace since our last update. In just three months, economists’ 12 month forward looking consensus on the probability of a U.S. recession soared from 22% in January to 65% following President Trump’s announcement of “Liberation Day” tariffs on April 2.¹ After a subsequent 90-day pause on most of these tariffs, recession odds dropped to around 45%. This ongoing policy uncertainty continues to weigh heavily on markets, undermining business and investor confidence.²
For perspective, the U.S. economy expanded at a year-over-year rate of 2.5% in the fourth quarter of 2024.³ This growth was primarily driven by robust consumer spending, which rose at a 4% annualized rate—the strongest pace since early 2023. Early first-quarter 2025 data indicated continued economic momentum, as both businesses and consumers accelerated purchases in anticipation of potential new tariffs. However, by March, indicators from the manufacturing and services sectors began to signal a slowdown in economic activity.⁴
On April 2, the announcement of additional tariffs quickly dampened expectations for economic growth while also exerting upward pressure on inflation. The Federal Reserve Chair Jerome Powell noted that the tariffs announced were significantly larger than expected and these tariffs will likely slow economic growth and stoke higher inflation.⁵ Meanwhile, the labor market has shown signs of softening. The unemployment rate edged up to 4.2% in March 2025 from 4.0% in January, reflecting a modest increase in joblessness and a slight cooling in employment growth. These conflicting dynamics—slowing growth alongside increases in unemployment and increasing risk of higher inflation—are prompting the Federal Reserve to reconsider its monetary policy plans for the remainder of the year.⁶


Source: Bureau of Labor Statistics¹⁰
- The Consumer Price Index (CPI) rose 2.4% year-over-year, down from 2.8% in February, mainly due to lower energy and travel costs.
- The Producer Price Index (PPI) dropped 0.4% from February, driven by a sharp 4% fall in energy prices. Annual wholesale inflation slowed to 2.7%, down from 3.2% in February.
- Despite this progress, President Trump’s new tariffs are expected to push prices higher in coming months, especially for food, vehicles, electronics, apparel, and furniture. Economists warn that most consumers will start to feel the impact by May, as higher costs work through supply chains.¹¹
Consumer inflation expectations remain elevated: the New York Fed’s survey shows one-year expectations at 3.6% in March, while the University of Michigan’s survey points to over 6% expected inflation in the next 12 months—both well above the current 2.4% CPI.
At this point, the stabilization trend we’ve seen in inflation over the last two years remains vulnerable to changes in tariff policies.
The US Labor Market and Unemployment Rates
Despite economic uncertainty and federal go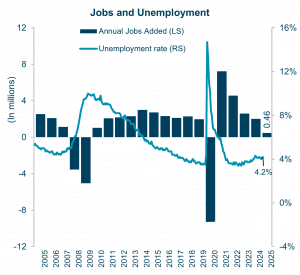 vernment layoffs—some under legal challenge—the labor market remains resilient. Nonfarm payrolls rose by 228,000 in March, well above the expected 140,000, though the three-month moving average fell to 152,000 from 184,000 in February. Job losses in the federal government were offset by gains in health care, retail, and transportation. The unemployment rate edged up to 4.2% in March from 4% in December, staying within a 4%–4.2% range since May 2024.
Note: RS and LS refer to the right and left series in the chart. Sources: U.S. Bureau of Economic Analysis, FRED, and U.S. BLS¹⁴
Average hourly earnings grew 0.3% in March and 3.8% over the past year. The recent tariffs announcements will likely put downward pressure on profitability of companies that could result in further business investments on hold and further layoffs.¹³ Similarly, federal layoffs will take time to show up in the unemployment numbers as many are still being challenged in the courts.
Policy changes under the Trump administration
The Trump administration is implementing many of its campaign promises on tariffs and immigration primarily through executive orders. As anticipated, significant policy changes have contributed to heightened market volatility. The Department of Government Efficiency (DOGE) has been positioned at federal agencies which has resulted in layoffs and reduction in government spending. Trump’s executive orders on immigration, reorganization of the federal agencies and associate layoffs, many of which are being challenged in the courts, have contributed to chaos.
Tariffs
 On top of previously announced tariffs, Trump’s tariff announcements in early April were heaviest on a subset of countries exporting more to the US than they import. Those tariffs are now paused until early July, except for tariffs on China. If the announced tariffs persist, they will be among the highest in more than a century and could upend global trade.¹⁵ When we consider the consequences of potential trade wars, increased inflation and slowing economic growth are likely.
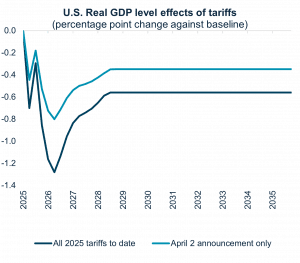
Source: The Budget Lab at Yale¹⁶
When we consider the consequences of potential trade wars, increased inflation and slowing economic growth are likely. Uncertainty can impact investment decisions, corporate spending, consumer confidence as well as consumer spending, each contributing negative impacts on economic growth. According to the Budget Lab at Yale University, all 2025 tariffs would result in a 0.9% drop in 2025 real GDP and increase prices by 2.3% in the short run. Higher costs could disproportionately hurt lower-income and minority households.¹⁷
Stagflation Risk
News headlines have highlighted concerns about stagflation, especially following the announcement of new tariffs. What is stagflation and what is the risk to the economy and markets?
Stagflation refers to a period characterized by high inflation, slow economic growth, and rising unemployment. Currently, economic growth, inflation, and unemployment rates do not show clear signs of stagflation, particularly when compared to the severe stagflation of the 1970s and 1980s.


Source: Factset¹⁸
However, Trump’s tariffs could increase that risk. Tariffs may push up prices (inflation), slow down economic growth, and lead to more layoffs as companies face higher costs and reassess their profitability. This is particularly challenging for the U.S. manufacturing sector, since not all raw materials or components can be sourced domestically. Additionally, if tariffs and market uncertainty reduce consumer sentiment and household wealth—including through falling stock prices—consumer spending could decline further, putting additional pressure on economic growth. These factors combined could increase the risk of stagflation in the future.
Market Update
 During the first quarter, equity markets experienced heightened volatility due to policy uncertainty, tariffs and geopolitical tensions. The US stock market surged after the election, rising almost 10% by inauguration day on the exuberance of Trump’s tax cuts and deregulation.¹⁹ In the first month of his second term, markets were relatively flat, rising just 1%. In late February, the Trump administration reignited trade wars through tariffs on Canada, Mexico, and China which drove volatility in the second half of the quarter.
Source: Sources: Morningstar, S&P Global, MSCI
The S&P 500 briefly entered correction territory or 10% slide from February’s peak in mid-March before ending the quarter 8.7% below the peak. Volatility as measured by the VIX (CBOE volatility index) also reached a five year high after the announcement of additional tariffs on April 2, right after quarter-end. We expect volatility to persist in the absence of clarity of tariffs.
The US equities market outperformance since the global financial crisis has resulted in the US market share of the MSCI All Country World Index increasing from 42% in 2009 to 66% at the end of Q1 2025.

Sources: Morningstar, S&P Global, MSCI
The increased representation has been driven broadly by:
- US technology sector leadership: most recently, the Magnificent Seven (M7) stocks (Apple, Microsoft, Alphabet, Nvidia, Meta, Amazon, and Tesla)
- Earnings superiority: US stocks benefited from significantly higher earnings contributions than developed international markets.²⁰
However, we are starting to see a rotation out of tech stocks with deterioration of the M7 and from US stocks to international stocks due to valuation discounts.
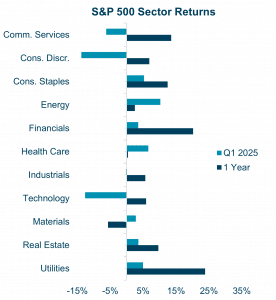
The S&P 500 index had a negative 4.6% return in Q1. The Technology, Communication Services and Consumer Discretionary sectors, key drivers of market growth over the past two years, weighed heavily on performance in Q1. The M7 stocks posted a collective return of -14.6%, in stark contrast to the 0.4% gain achieved by the remaining 493 stocks in the S&P 500 index. NVIDIA lost more than 19%, Alphabet (Google) lost 18%, and Tesla fell more than 35%. This contraction led M7’s overall weighting in the S&P 500 to decrease from 34% to 30% at the end of the quarter. Representing approximately 30% of the S&P 500’s weight at the end of this quarter, the recent underperformance highlights the continued elevated concentration risk from these companies.
Consumer Discretionary, which led the market in the prior quarter, became the worst performing sector in the first quarter. This shift was driven by concerns over declining consumer confidence, rising interest rates, tariffs, and signs of a broader economic slowdown. In contrast, defensive sectors like healthcare and energy- both of which lagged in Q4 2024, demonstrated relative strength in the first quarter.
Non-US equities outperformed, with European and Chinese equity markets benefiting from fiscal stimulus aimed to boost growth and enhance defense capabilities. Besides the outperformance of international developed and emerging markets compared to the US, value stocks also outperformed growth stocks. Small caps outperformed large caps.
Fixed income markets delivered mostly positive returns, benefiting from a flight to safety amid equity sell-offs, a reversal from the prior quarter. The Treasury yield curve steepened slightly as the yields on the longer end of the curve increased due to investors demanding higher rates for holding longer dated securities. The fed funds rate currently ranges from 4.25%-4.50% as the FOMC decided not to cut rates further in Q1 reflecting caution amid economic uncertainty and elevated inflation projections.
In an unusual shift, interest rates have recently behaved in ways that defy the typical pattern seen in past economic cycles. Historically, the federal funds rate and Treasury yields—especially the 10-year yield—have moved in tandem, with both declining when the Federal Reserve cuts rates, reflecting expectations of slower economic growth and increased risk aversion.²¹ However, since the September 2024 interest rate cut and the results of the November election, this relationship has broken down: the 10-year Treasury yield increased instead of decreasing alongside the Federal Reserve’s rate cuts.²²

Note – Current cycle started in September 2024. Historical average includes rate cut cycles from 1998, 2001, 2007 and 2019. Sources: Federal Reserve, U.S. Department of the Treasury, Apollo.²³
Normally, when the Fed lowers the fed funds rate, Treasury yields drop as well, primarily because the Fed cuts rates when the economy is already slowing with increased unemployment and reduced spending, which further drive yields down. In 2024, the Fed cut rates preemptively—before clear signs of a recession—to signal its intent to prevent deterioration in the labor market. At the same time, investors demanded higher yields for holding longer-maturity bonds, resulting in a divergence between the Fed funds rate and Treasury yields. While the expected negative impact of tariffs on economic growth led to a risk-off environment and falling 10-year Treasury yields in early 2025, the divergence persists, as the economy has not entered a recessionary phase.
Tariff-related, unprecedented market plunges in March and April have created significant uncertainty for investors, mirroring the uncertainty experienced by our communities. We recognize that these market movements are intentional and likely just the beginning of ongoing volatility.
As always, we recommend building portfolios that are resilient in the face of uncertainty. Looking ahead, we believe that investors who plan their spending needs well in advance will be better positioned to weather future market fluctuations. The more time we have to prepare for upcoming spending, the less vulnerable we will be to sudden changes in the market or shifts in federal trade policies.
Authors
Jane Swan is a Partner, Senior Advisor, and Chief Advisory Officer at Veris, and she holds the Chartered Financial Analyst (CFA®) designation. Bio.
Roraj Pradhananga is a Partner and CIO at Veris and a Certified Investment Management Analyst (CIMA®) and Certified Public Accountant (CPA). Bio.
Sources
1. https://www.investmentnews.com/industry-news/economists-maintain-recession-alert-in-spite-of-trump-pivot/260097
2. https://www.wsj.com/economy/trade/us-economic-outlook-trump-b4e3469a
3. https://www.pbs.org/newshour/economy/u-s-economy-grew-2-4-percent-in-4th-quarter-of-2024-after-upgrade-in-growth-estimate
4. https://www.atlantafed.org/cqer/research/gdpnow
5. https://www.nytimes.com/2025/04/04/business/economy/powell-trump-tariff-inflation-risk.html
6. https://www.reuters.com/world/us/latest-updates-fed-chair-jerome-powell-speak-us-economic-outlook-2025-04-16/
7. https://www.bea.gov/data/gdp/gross-domestic-product
8. https://www.cnbc.com/2025/04/25/trump-tariffs-news-car-purchases-rise-consumer-spending-slows.html
9. U.S. Bureau of Economic Analysis, FRED, and U.S. Bureau of Labor Statistics
10. Source: Bureau of Labor Statistics, FactSet
11. https://budgetlab.yale.edu/research/where-we-stand-fiscal-economic-and-distributional-effects-all-us-tariffs-enacted-2025-through-april
12. Source: Bureau of Labor Statistics, FactSet
13. https://www.reuters.com/sustainability/sustainable-finance-reporting/tariff-induced-uncertainty-seen-curbing-us-job-growth-april-2025-05-02
14. U.S. Bureau of Economic Analysis, FRED, and U.S. Bureau of Labor Statistics
15. https://apnews.com/article/global-economy-tariffs-imf-d15febaaaab65c7df8538cce170231eb
16. Source: The Budget Lab at Yale
17. https://www.dallasfed.org/research/economics/2023/0110
18. FactSet
19. https://www.ssga.com/us/en/intermediary/insights/uncommon-sense/is-exorbitant-government-spending-the-key-to-stock-market-prosperity
20. https://privatebank.jpmorgan.com/latam/en/insights/markets-and-investing/ideas-and-insights/are-you-ready-to-embrace-the-potential-of-global-equities
21. https://www.schwab.com/learn/story/fixed-income-outlook
22. https://www.jpmorgan.com/insights/markets/top-market-takeaways/tmt-why-have-ten-year-us-treasury-yields-increased-since-the-fed-started-cutting-rates
23. Federal Reserve, U.S. Department of the Treasury, Apollo
Disclaimer
The information contained herein is provided for informational purposes only and should not be construed as the provision of personalized investment advice, or an offer to sell or the solicitation of any offer to buy any securities. Rather, the contents including, without limitation, any forecasts, projections, and forward-looking statements simply reflect the opinions and views of the authors.
All expressions of opinion reflect the judgment of the authors as of the date of publication and are subject to change without notice. There is no guarantee that the views and opinions expressed herein will come to pass. Additionally, this document contains information derived from third party sources. Although we believe these third-party sources to be reliable, we make no representations as to the accuracy or completeness of any information derived from such third party sources and take no responsibility therefore. Information related to the performance of certain benchmark indices is provided for illustrative purposes only as investors cannot invest directly in an index. Past performance is not indicative of or a guarantee of future results. Investing involves risk, including the potential loss of all amounts invested.