
Market Recap: 2019 Finishes Strongly
By Jane Swan and Roraj Pradhananga
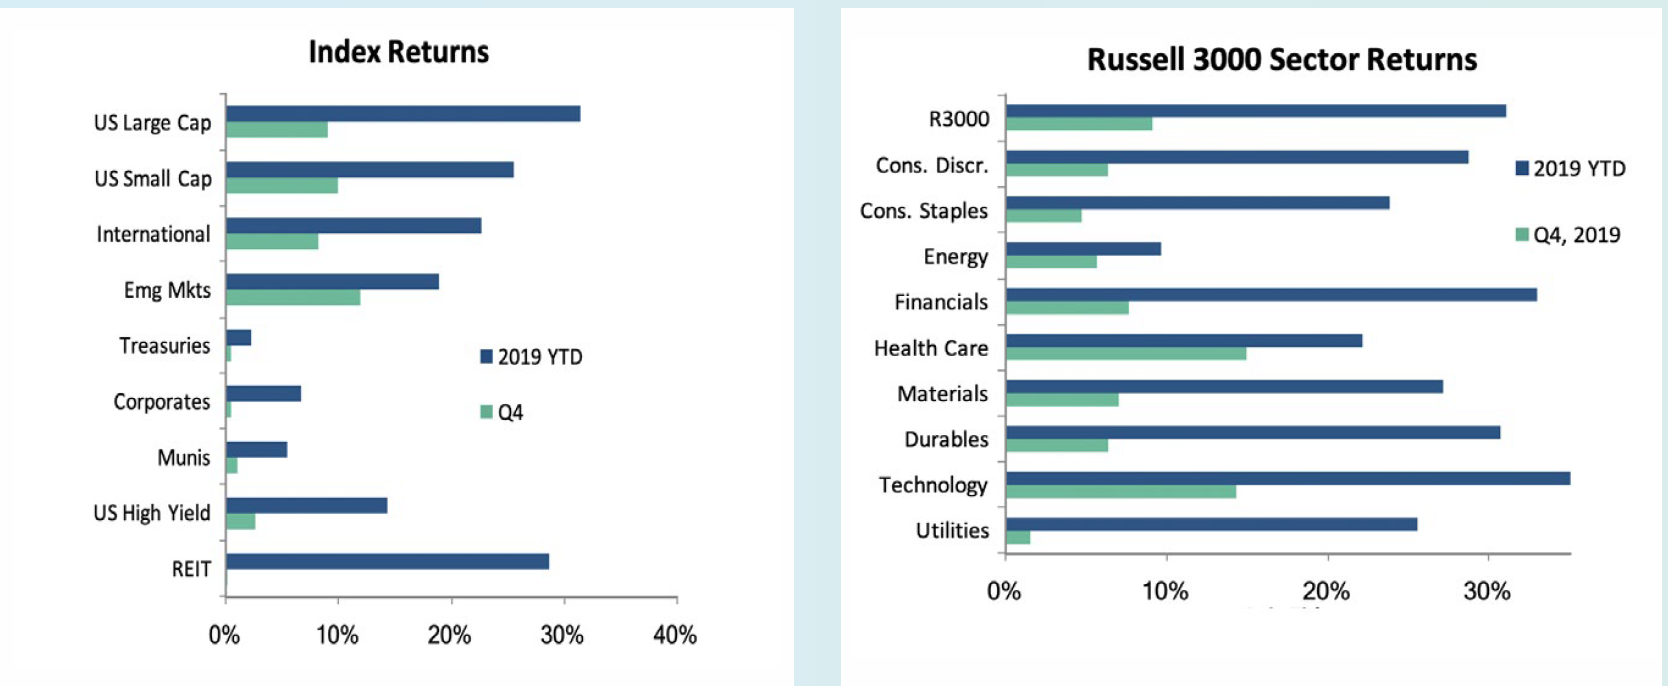
Positive returns in the fourth quarter helped propel all major indexes
The year started with a robust recovery from the negative returns at the end of 2018, followed by a resting period in the third quarter, and then more growth at the end of 2019. Continued moderate expansion in the economy was a tailwind for investors, with total return for both bond and stock investors at the high end of historic norms. The greatest gains were from risk asset classes (stocks, real estate, and high yield bonds). Investors in investment grade bonds were also rewarded. Within the Russell 3000 (broad index of US stocks), the strongest returns came from the largest components. Technology jumped 14.3% in the quarter and 46.7% for the year. Financials were up 7.6% in the quarter and 32.9% for the year. Every sector other than Energy (up 9.6% for the year) increased by double digits. Investors were rewarded by the almost 11-year stock market expansion, but the gains have been not evenly translated to all participants in the economy.
Since the stock market began its recovery (March 2009) and the end of the last recession (October 2009), much has changed. Unemployment has fallen from 10% to under 3.5%. Inflation remains low, currently below the target rate of 2%. Average family income (when measured using the statistical mean), has grown by 35%, which is just over 3% per year. Profits to stock owners, measured by the S&P 500, are now 498%. Companies have benefited from low interest rates, corporate tax cuts, increases in worker productivity, and in many cases, reductions in regulations.
Uneven Gains
In statistics, there are two frequently used approaches to calculating an average (or mean) and median. In common usage, average almost always assumes use of the mean method of calculation. The process for finding the mean considers all observations and divides by the number of observations. If you have ten observations of hourly wages and nine of them reflect $10 per hour and the 10th observation reflects $500, the average hourly wage of those 10 people is $59. Using the statistical measure of median, we organize all observations in numerical order and take the mid-point observation.
In the example above, the median worker earned $10. As income inequality grows, we believe that monitoring the difference between average (mean) and median becomes an important measure of the financial strength of the workforce. This is demonstrated in the graph below.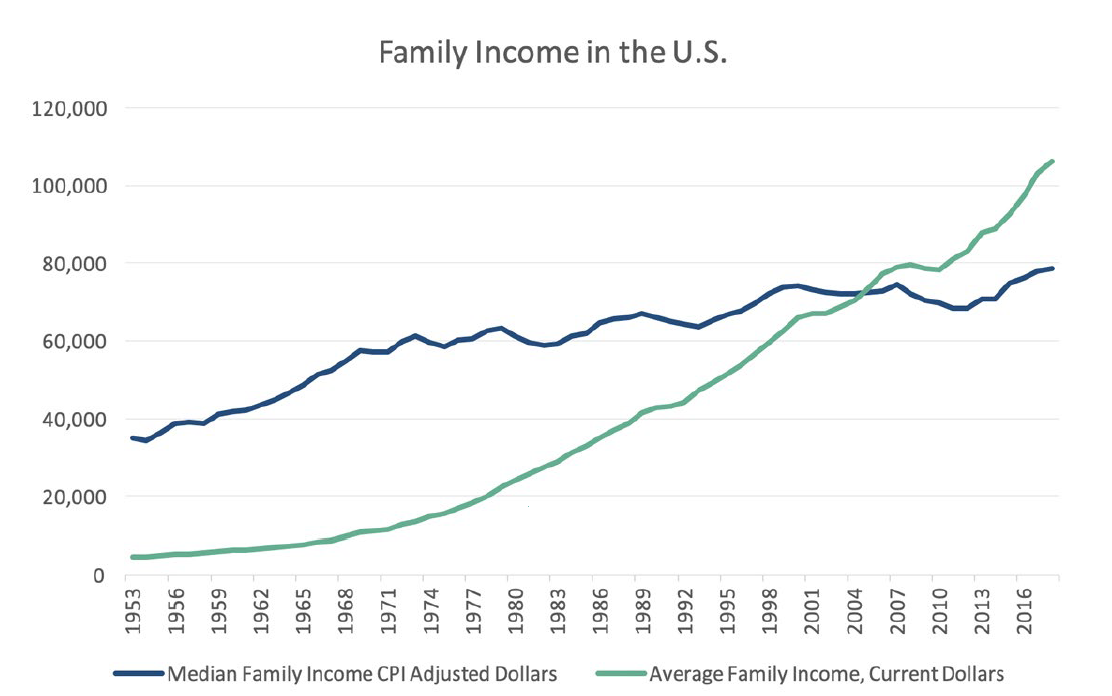
The green line showing the average (mean) income for families has grown at a much higher rate than the blue line, which represents median income. If the highest wages grow while other wages remain steady, the average will grow while most workers experience no change.
A recent JP Morgan report noted the differences in spending rates between families earning the highest 10% of incomes and the other 90% of U.S. families. They found that the highest earners spent just 68% of their income, while the rest of the population averages spending of 101% of income. The divide between average and median earners and the spending patterns of high and lower earners has implications on the growth rate of the broader economy. If spending rates are highest among those with the slowest growing income but low among those experiencing high rates of growth in real income, the consumer contribution to economic growth will be limited. It also has implications for the savings rates of most families.
In the years since the end of the recession, the economy has grown at an average annual rate of 2.2%. The average economic growth during expansions of the last 50 years has been 3.7%. The majority of GDP (almost 70%) comes from consumer spending. Low growth in wages for the majority of American families during this economic expansion is a part of the explanation for the lower-than-average growth of the economy during this long, but tepid recovery.
Meanwhile, this limited growth in most wages mixed with extremely accommodating monetary policy, stock buy backs and growing dividends have propelled the stock market to record highs despite this slow growth environment. We have a sense of the economy doing better than it is because we see the stock market soaring. While observed by many, the benefits are largely constrained to the top 10%. Market strength and economic strength are often related, but they are not the same thing.
2020 Planning
With election year and impeachment on everyone’s mind, Veris monitors for changes to the pillars of the economy, which are the strength in corporate earnings and bond markets. We also recognize that portfolio management is a long-term process. An important factor is not just structuring a portfolio for growth, but also structuring a portfolio to provide for spending needs during periods of decline or volatility. As some investors celebrate these historic market gains, we invite and encourage all of our clients to reach out to your Veris wealth advisor to be sure your portfolio is positioned for the road ahead.