Equity Markets Regain Footing in Q2 2018
By Jane Swan, CFA, Partner
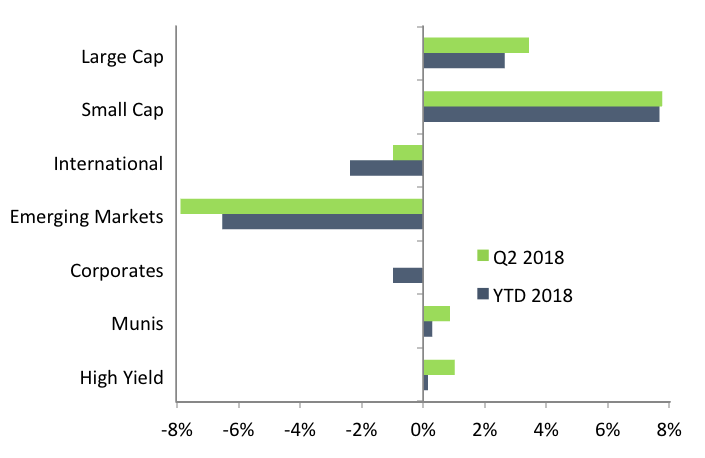
After a rough start to 2018 in US financial markets, domestic equities are largely back on track. The charts below show the return for each asset class and highlight the strong return of US markets in the quarter. The losses of the first quarter were reversed. This wasn’t the case in international markets, which were very negative. Fixed income markets reacted to yet another interest rate hike and produced flat returns.
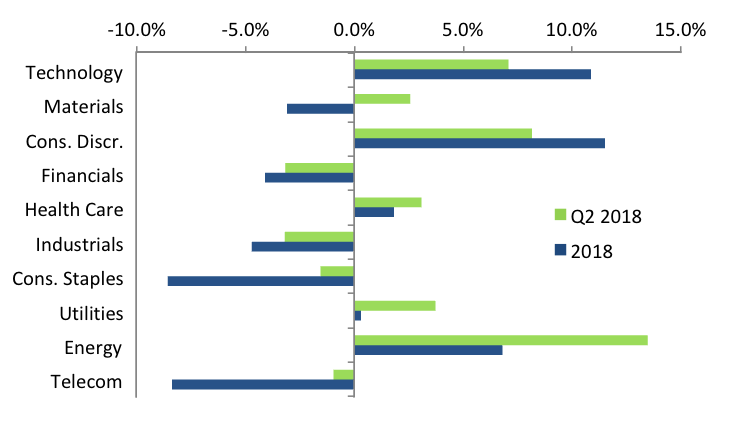
The strongest returns for the quarter came from Energy stocks. The sector returns graph reflects that the greatest growth came largely from more cyclical sectors. These are sectors that tend to respond well when consumers are optimistic.
With the S&P up 2.6 percent year-to-date, it might be hard to remember February, when the year-to-date return was negative 10 percent. While we have not yet fully returned to January’s market high, the February correction has not derailed the now six-and-a-half year market expansion.
Looking at what changed over the second quarter, markets appear to be adjusting to a new normal. The market overreacts to fear or enthusiasm over political announcements. With so many pronouncements and almost immediate government revisions, plus often contradictory analysis from pundits, it’s difficult for the market and investors to make sense of the news. A case in point is the long-term impacts of tariffs and retaliatory tariffs in the second quarter. While the long-term impacts are speculative at best, the actual implementation of US tariffs on imported goods were about two-thirds the size of the original announcement.
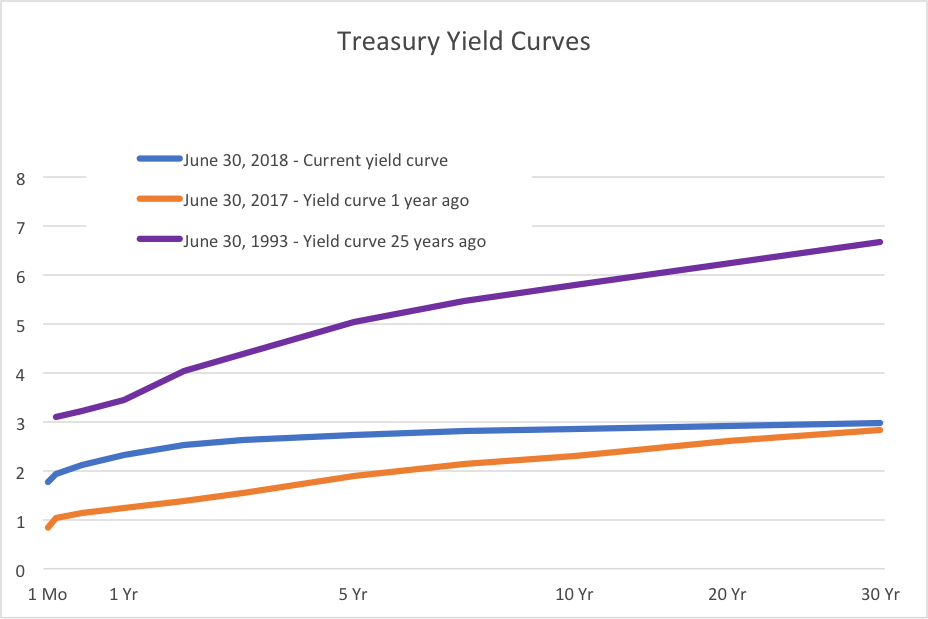
Also interesting is the broader reaction of the bond market to ongoing interest rate hikes. Thus far, the longer end of the yield curve hasn’t responded to the Federal Reserve’s recent rate increases.
The chart shows the current yield curve (6/30/2018), the yield curve from one year ago (6/30/2017) and a more typical looking yield curve from 25 years ago (6/30/1993). You can see that in the last year, while yields on the near end of the curve have moved up almost a full percentage, the farther end of the curve has hardly moved at all. Thirty-year bond yields are up just 0.14 percentage points from a year ago.This flattening of the yield curve is typically an ominous sign for markets. It shows that bond purchasers are anticipating either the possibility of inflation or an economicdecline.
At Veris, we constantly monitor the news, but keep focused on fundamentals and actual data. Corporate earnings are expected to grow about 20 percent over the next 12 months, significantly higher than the 20-year average of 6.2%. Reported unemployment remains very low, as does wage growth. With core inflation remaining at low levels, consensus expectations are that the Federal Reserve will raise interest rates two more times this year.
There are several other key indicators we continue to monitor closely. We are watching whether earnings reports come in at or near expected levels or whether they will be significantly revised. We also are watching the yield curve for continued flattening or a reversion to a more normal, sloped curve. The near and longer-term economic impact of global trade and tariff policies and fluctuations in oil prices also have the possibility of derailing the long financial expansion.


