Economic Update Q3 2016
by Jane Swan, CFA, Senior Wealth Manager
In an election year with no shortage of drama and surprises, the market has been relatively calm and steady. Market volatility often increases during an election year as uncertainty looms over the potential market impact of a new administration. We saw this clearly most recently in 2008. The risk in an investment is considered higher when there is potential for something unpredictable to happen.
Election Year Stock Market Volatility Measured by the VIX
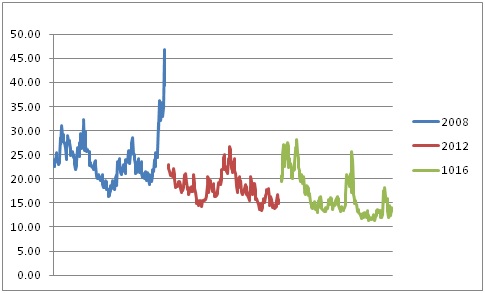
Chicago Board Options Exchange
The brief period of high volatility came not from changes in US election forecasts but from the somewhat surprising Brexit results. The lower volatility going into the U.S. election and the steady growth of equity markets in the first three quarters of the year may leave little room for the post election bounce often experienced.
There are no negative numbers to report across major asset classes for the quarter, either fixed income or equity. Low volatility and steady growth contributed to a 2.5 percent increase in the S&P 500 (U.S. large cap) bringing year-to-date growth to 7.8 percent. The Russell 2000 index (U.S. small cap) was up 9.1 percent for the quarter, 11.5 percent for the year. International markets continued to recover from the second quarter Brexit vote with the MSCI EAFE (developed international markets) up 6.5 percent for the quarter, bringing year-to-date to a positive 2.2 percent. Emerging markets were the best performing asset class, up 9.2 percent in the quarter and 16.4 percent for the year.
3rd Quarter and YTD Growth in Key Asset Classes
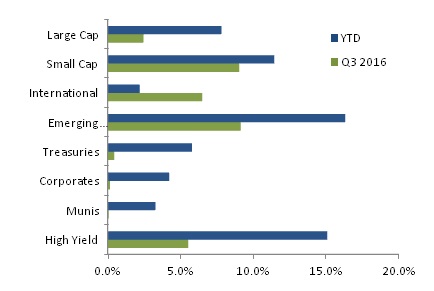
PMC Capital Markets Flash Report for periods ending Sept 30, 2016
Investment grade domestic fixed income markets were the beneficiary of greater market uncertainty earlier in the year. The low volatility of the third quarter was reflected in very quiet returns to fixed income. U.S. Treasuries returned 0.5 percent in the quarter, bringing year to date returns to 5.8 percent. Corporate bonds were up an even smaller 0.2 percent for the quarter, 4.2 percent year-to-date. Municipal bonds were up just 0.1 percent for the quarter, 3.3 percent for the year-to-date. Outside of investment grade, low volatility contributed to a continued surge from high yield with the index up 5.6 percent for the quarter, 15.1 percent year-to-date.
3rd Quarter and YTD Returns by Industry Sector
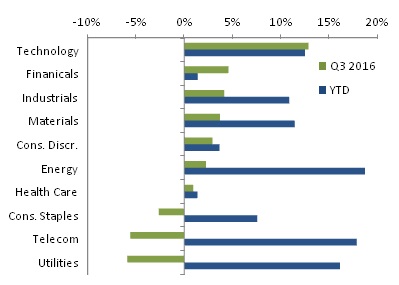
PMC Capital Markets Flash Report for periods ending Sept 30, 2016
Sector returns for the quarter trimmed gains from earlier in the year, but left all sectors of the economy in positive territory for the year. Strongest growth in the quarter came from technology which completely recovered from what was a negative first half of the year. While the energy sector remained the strongest sector year-to-date (up 19 percent for the year), the price of oil hit a plateau during the quarter. The results were a 2 percent increase in energy stocks prices for the quarter. Utilities and telecom remain among the greatest contributors to growth for the year despite negative returns in the third quarter.
Price of Oil
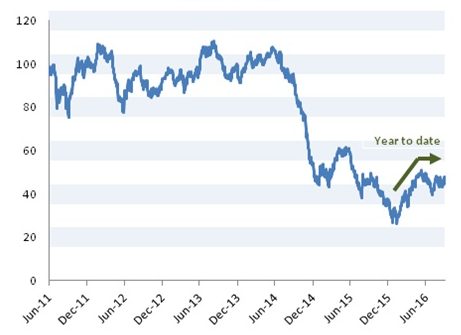
Federal Reserve Bank of St. Louis
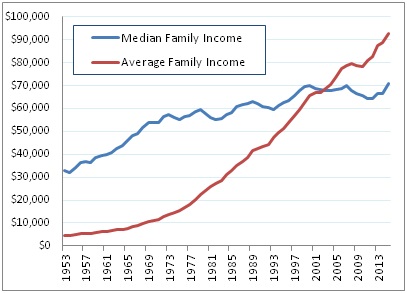
At this time, pollsters have high conviction in the outcome of the presidential election with the greatest uncertainty residing in the outcome of congressional, as well as state and local elections. Less certain is the path towards reconciliation of a deeply divided population. As economists ponder the catalysts to our political divisions, they will point to a shrinking middle class and its stagnant income growth. This is well illustrated by a comparison of two different definitions of ‘average’ Income. The chart below shows historical growth rates of average (also known as “mean”) and median family incomes. The average family income considers all family incomes and takes the mathematical average per family. The median stacks all family incomes and for each time period, finds the number in the middle of the stack. The median measure is often considered a better measure of the typical family because it is less biased by extremely high incomes. The graph below demonstrates this difference. While average incomes have grown considerably since the economic downturn, the typical (median) family had no actual growth in incomes over the last 8 years.
Mean and Median Income
Federal Reserve Bank of St. Louis
As they seek to repair our fraying social fabric, we invite the incoming administration and congress to apply the lessons we have learned from various approaches to impact investing. Gender lens investments, for example, demonstrate the improved decision making capabilities of diverse teams. Men and women working together are more likely to incorporate a broader array of risks and opportunities in their problem solving. Enhanced innovation is more likely when we tap the collective wisdom of people of different races, nationalities, religions, sexual orientations, gender identities, abilities, sizes, and generations. Businesses developing technologies for mitigating climate change have the potential to drive future economic growth. Addressing access to capital in under-resourced communities has the potential to alleviate systemic economic inequality.
In short, impact investing is emerging as a ‘proof of concept’ that diverse and balanced teams are far more likely to deliver our ultimate goals: inclusive and prosperous economies thriving in healthy and sustainable eco-systems.