Economic & Market Update: Q3 2025
By Jane Swan, CFA and Roraj Pradhananga, CIMA & CPA
Executive Summary
Amidst ongoing US policy unpredictability and signs of a softening labor market, the US economy and markets have continued to demonstrate notable resilience. A long-awaited Federal Reserve interest rate cut, and strong corporate earnings supported equity and credit markets – yet policy shifts, elevated stock valuations, and ongoing geopolitical tensions continue to pose potential headwinds. Looking back on the third quarter and ahead to the remainder of 2025 and the new year, several trends seem to be emerging.
- Equity Markets Continue Record-Setting Rally: US indices hit record highs in Q3, driven by strong earnings and Fed easing. The rally, led by large-cap tech companies on continued AI enthusiasm, broadened to small-caps as the Fed cut rates. Small-cap stocks posted their best quarter since late 2023. A weaker dollar continues to support emerging markets.
- Consumer Resilience and Corporate Profits Drive Optimism: Strong Q2 corporate earnings and resilient consumer spending, primarily driven by the top 10% of households, supported markets. However, signs of stress are emerging in lower-income households, as seen in the rise of sub-prime auto loan delinquencies.¹
- Fed Resumes Easing with a September Rate Cut: The Federal Reserve delivered its first rate cut of 2025 in September as concerns shifted from inflation to a cooling labor market. Expectations of further easing drove short-term Treasury yields lower. Lower rates supported credit markets.
- The Labor Market Cools: Despite a relatively low unemployment rate of 4.3%, the job market showed clear signs of softening. Job creation slowed, and downward revisions to prior months indicated a “no-hire/no-fire” and “low quit rate” environment.
- The AI Narrative Evolves: AI remains a key driver for tech and semiconductor stocks, but investors are more closely scrutinizing monetization, productivity gains, competitive pressures, and return on investments of AI spending.
- Tariff Uncertainty Lingers Amid Shifting Policies: Tariff volatility eased compared to Q2 as some temporary agreements were reached, however, the heightened rhetoric and escalating tariff rates began to impact consumer prices and corporate outlooks, raising concerns about future economic growth.
US Economic Review: Growth Trends
After a strong 3.8% GDP growth in Q2 driven by consumer spending and fewer imports compared to Q1, the US economy’s momentum appears to have slowed in Q3. Early estimates suggest slower 2.1% growth in the third quarter. Spending was resilient with 50% of spending driven by the top 10% of households.²
Manufacturing remains in contractionary territory though at a slower pace. The Institute of Supply Management (ISM) Manufacturing Index increased to 49.1% in September, still below the 50 mark that signals expansion.
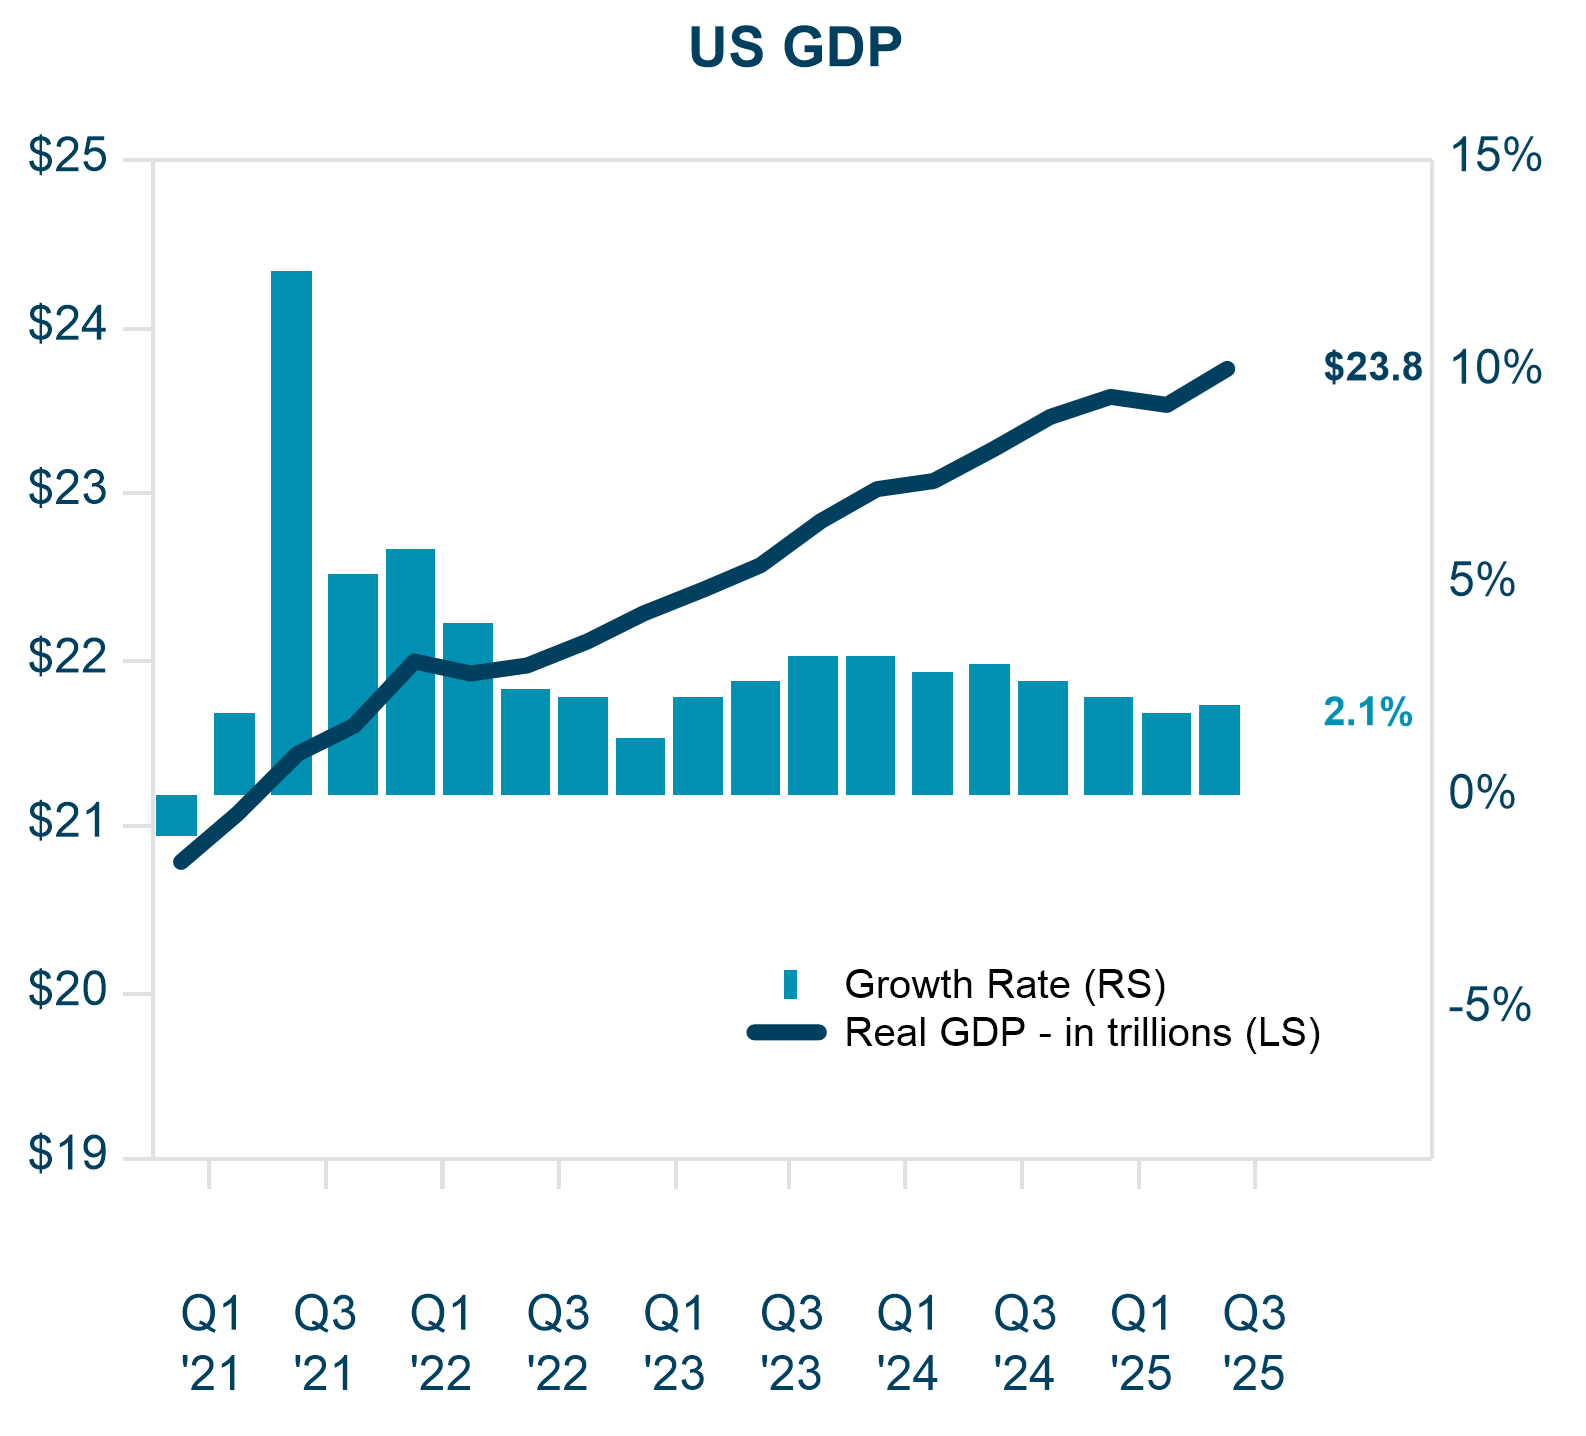
Chart: US GDP data from Q1 2021 to Q3 2025³
Global demand softness and trade tensions continue to weigh on the sector. Household sentiment measures slipped, with surveys indicating growing concerns about labor market prospects and persistent inflation pressures.⁴
The Labor Market
After months of perceived strength, the US labor market exhibited clear signs of cooling in the third quarter of 2025 as the unemployment rate rose to 4.3%. While this is still a relatively low unemployment rate, the Federal Reserve cut its policy rate in September by 25 bps 0.25% amid concerns about downside risks to growth.
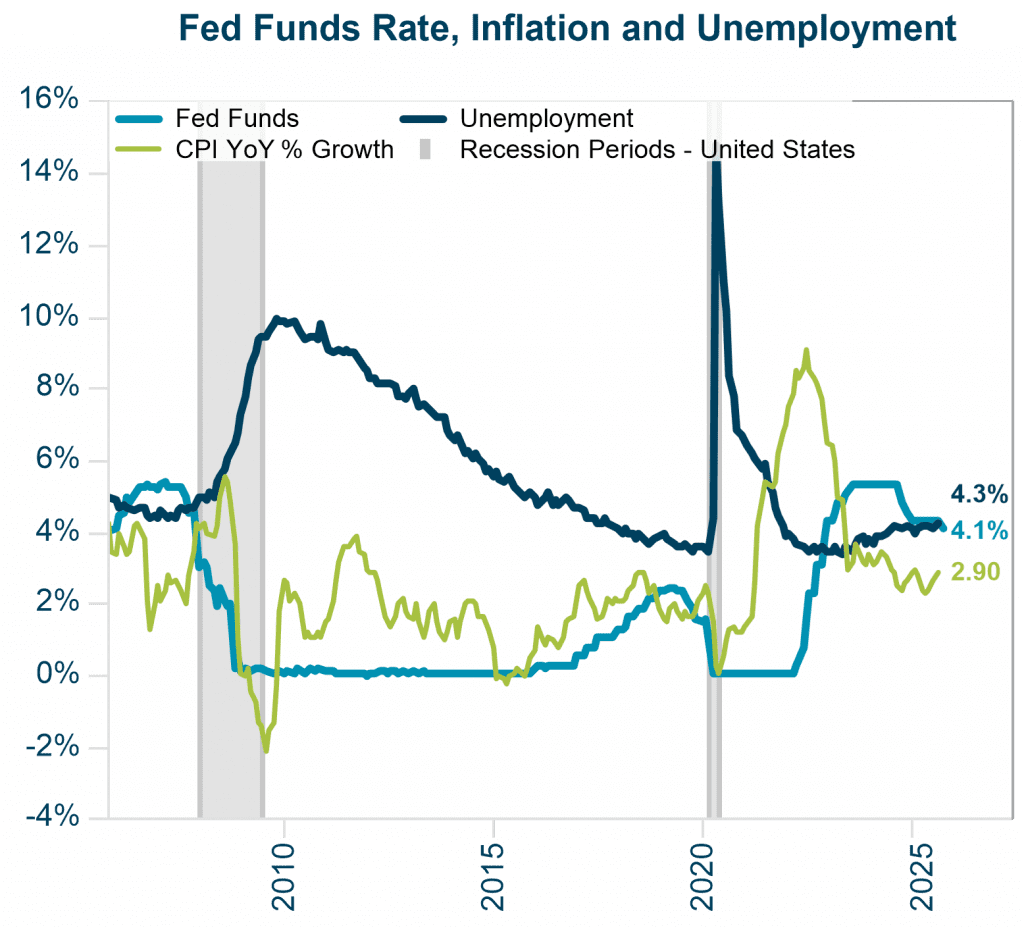
Chart: U.S. unemployment trends compared to the Fed funds rate, and CPI year-over-year % growth between 2010 and 2025 with recessionary periods marked in gray. ⁵
Monthly payroll gains lost steam – July’s job growth of 79,000, followed by a mere 22,000 in August and 50,000 in September are significantly lower than the 168,000 average job gain per month in 2024.⁶ While the Bureau of Labor Statistics’ (BLS) latest revisions cut an additional 911,000 jobs from the total for the 12 months through March 2025, which reinforces the perception of the depth of the slowdown, this practice is not unusual as BLS revised total jobs by 818,000 in March 2024.⁷ Critics have pointed to the reliability of data from BLS as a result of these revisions. Dismissal of the Commissioner of Labor Statistics and delayed reporting as a result of government shutdown will continue to feed on this narrative.
Businesses seem to be pressing pause rather than hitting the breaks. Many have adopted a cautious stance towards new hires and growing economic uncertainty. The good news is that layoffs have remained relatively limited, suggesting employers are hesitant to lose talent even as growth may cool.
Inflation Trends
The impact of tariffs on inflation are mixed as negotiations continue, and deadlines are extended. Companies haven’t fully passed on higher costs from tariffs to consumers as earnings remain elevated, but inflation readings are moving up.⁸ Headline inflation inched up to just below 3% year-over-year in the third quarter, largely due to higher energy and food costs. Core goods prices remained stable, but services inflation, driven largely by shelter, persisted above 3% well above the Fed’s target. The Personal Consumption Expenditures (PCE) price index rose 2.1% in Q2, showing that price pressures may be easing but are not gone. Higher food and energy prices have combined with cuts to Federal programs providing food support continue to increase the already high pressures on low-income families.
Monetary Policy
At its September meeting, the Federal Reserve cut interest rates by 0.25% to a target range of 4% to 4.25%. Chair Jay Powell called it a “risk management” move designed to cushion a cooling labor market and prevent a deeper slowdown. The Fed highlighted progress on inflation but stressed ongoing risks tied to growth and trade policy uncertainty.
Concerns around Fed independence continued as the administration tried to remove Governor Lisa Cook. However, markets have reacted sanguinely to the administration’s repeated attempt to influence the Fed.
Markets largely expected the cut, and investors are closely monitoring Federal Reserve signals on the pace of future rate cuts, with monetary policy remaining a key driver of market dynamics.
Overall, the economy looks set for slower growth, with inflation, trade policy, and monetary decisions expected to shape the path forward.
Market Update
It appears investors continue to overlook risks associated with rising equity valuations, elevated inflation, weakening labor market, fiscal deficit and policy uncertainty. US public equities delivered another strong quarter in Q3, with major indices nearing record highs on continued strong earnings, AI enthusiasm, economic resilience, upfront boosts from the tax bill, and a long-awaited Fed rate cut.
Fixed income markets also posted positive returns as yields moved lower, and credit spreads tightened. Market volatility remained low in Q3 compared to the volatile start to the year despite the looming threat of a government shutdown and ongoing tariff and trade policy uncertainty.
Stock Trends
Global equities were positive with major indices nearing record highs. S&P 500 and Nasdaq repeatedly set record highs on resilient earnings, continued AI enthusiasm, and tech stock leadership. S&P 500 was up nearly 35% as of September 30 from April 8 lows after the tariff announcements.
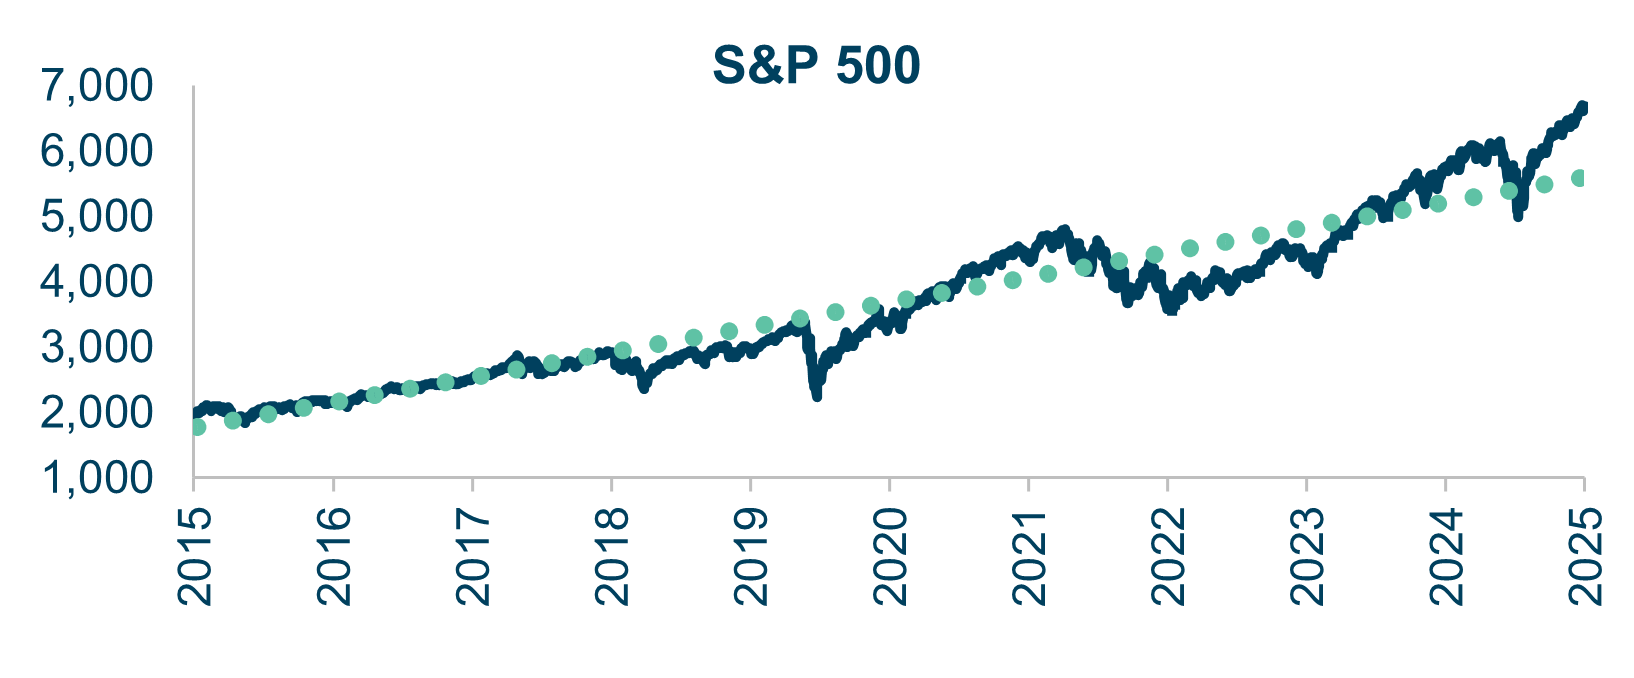
Chart: Index Returns chart comparing Q3 2025 with YTD and 3-Year; S&P 500 data between 2015 and 2025⁹
Small caps outperformed large caps with the Russell 2000 index gaining 12.4% in Q3 as a result of fed rate cuts and continued easing expectations. Small caps would benefit from lower interest rates and tax breaks from the tax bill.
Value stocks also rallied in the quarter. Emerging markets (EM) outperformed developed international equities, supported by easing inflation and policy support in China and India. A weaker dollar continues to benefit EM performance.
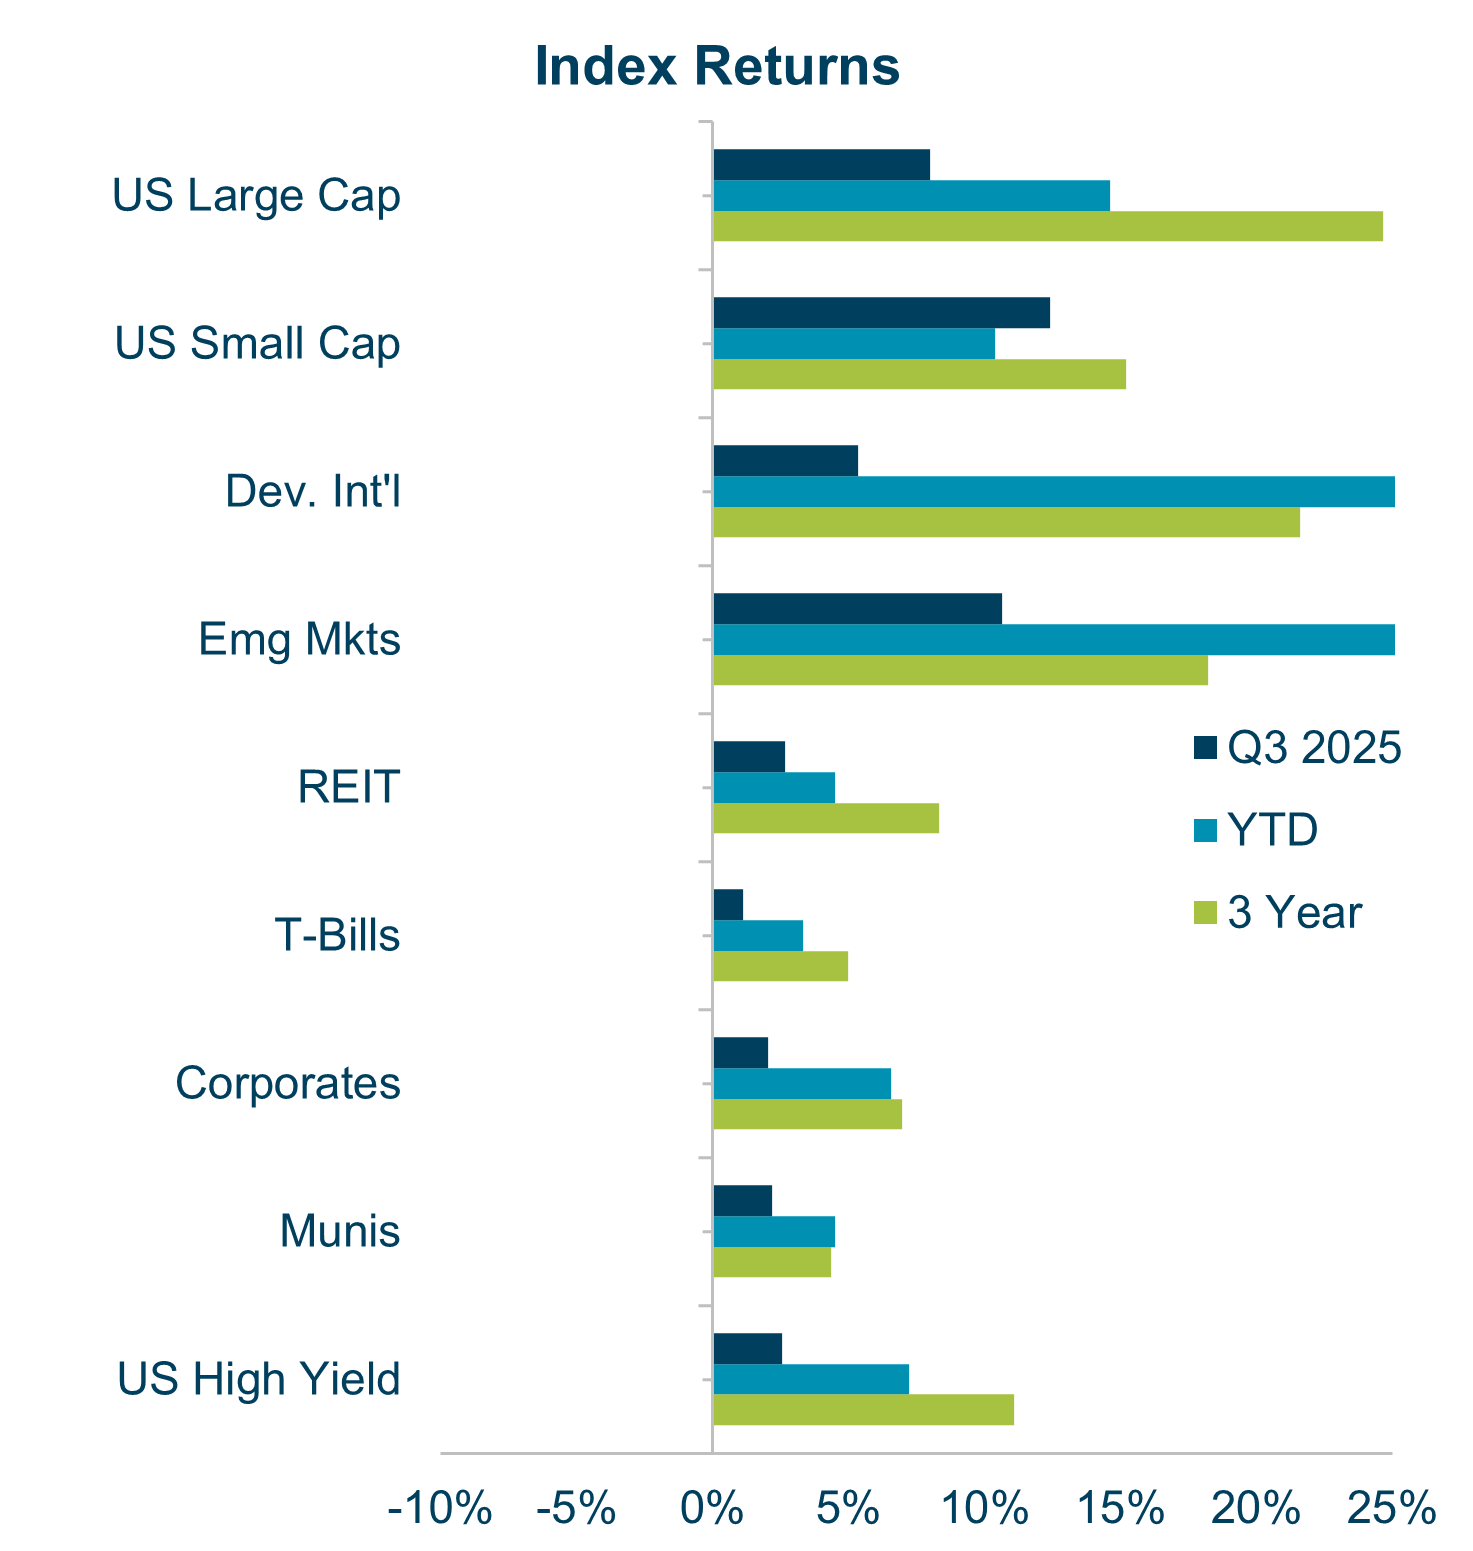
Chart: S&P 500 Sector Returns comparing Q3 2025 and YTD¹⁰
Both the S&P 500 and the S&P 500 ex-Magnificent Seven delivered positive returns year to date — 18% and 14%, respectively — indicating that breadth improved modestly outside the top names. Even so, the Magnificent Seven stocks drove nearly half of the S&P 500’s YTD performance. Nvidia remained the clear leader with a 277% gain since Jan 2024, while Meta, Tesla, and Alphabet also posted strong advances.
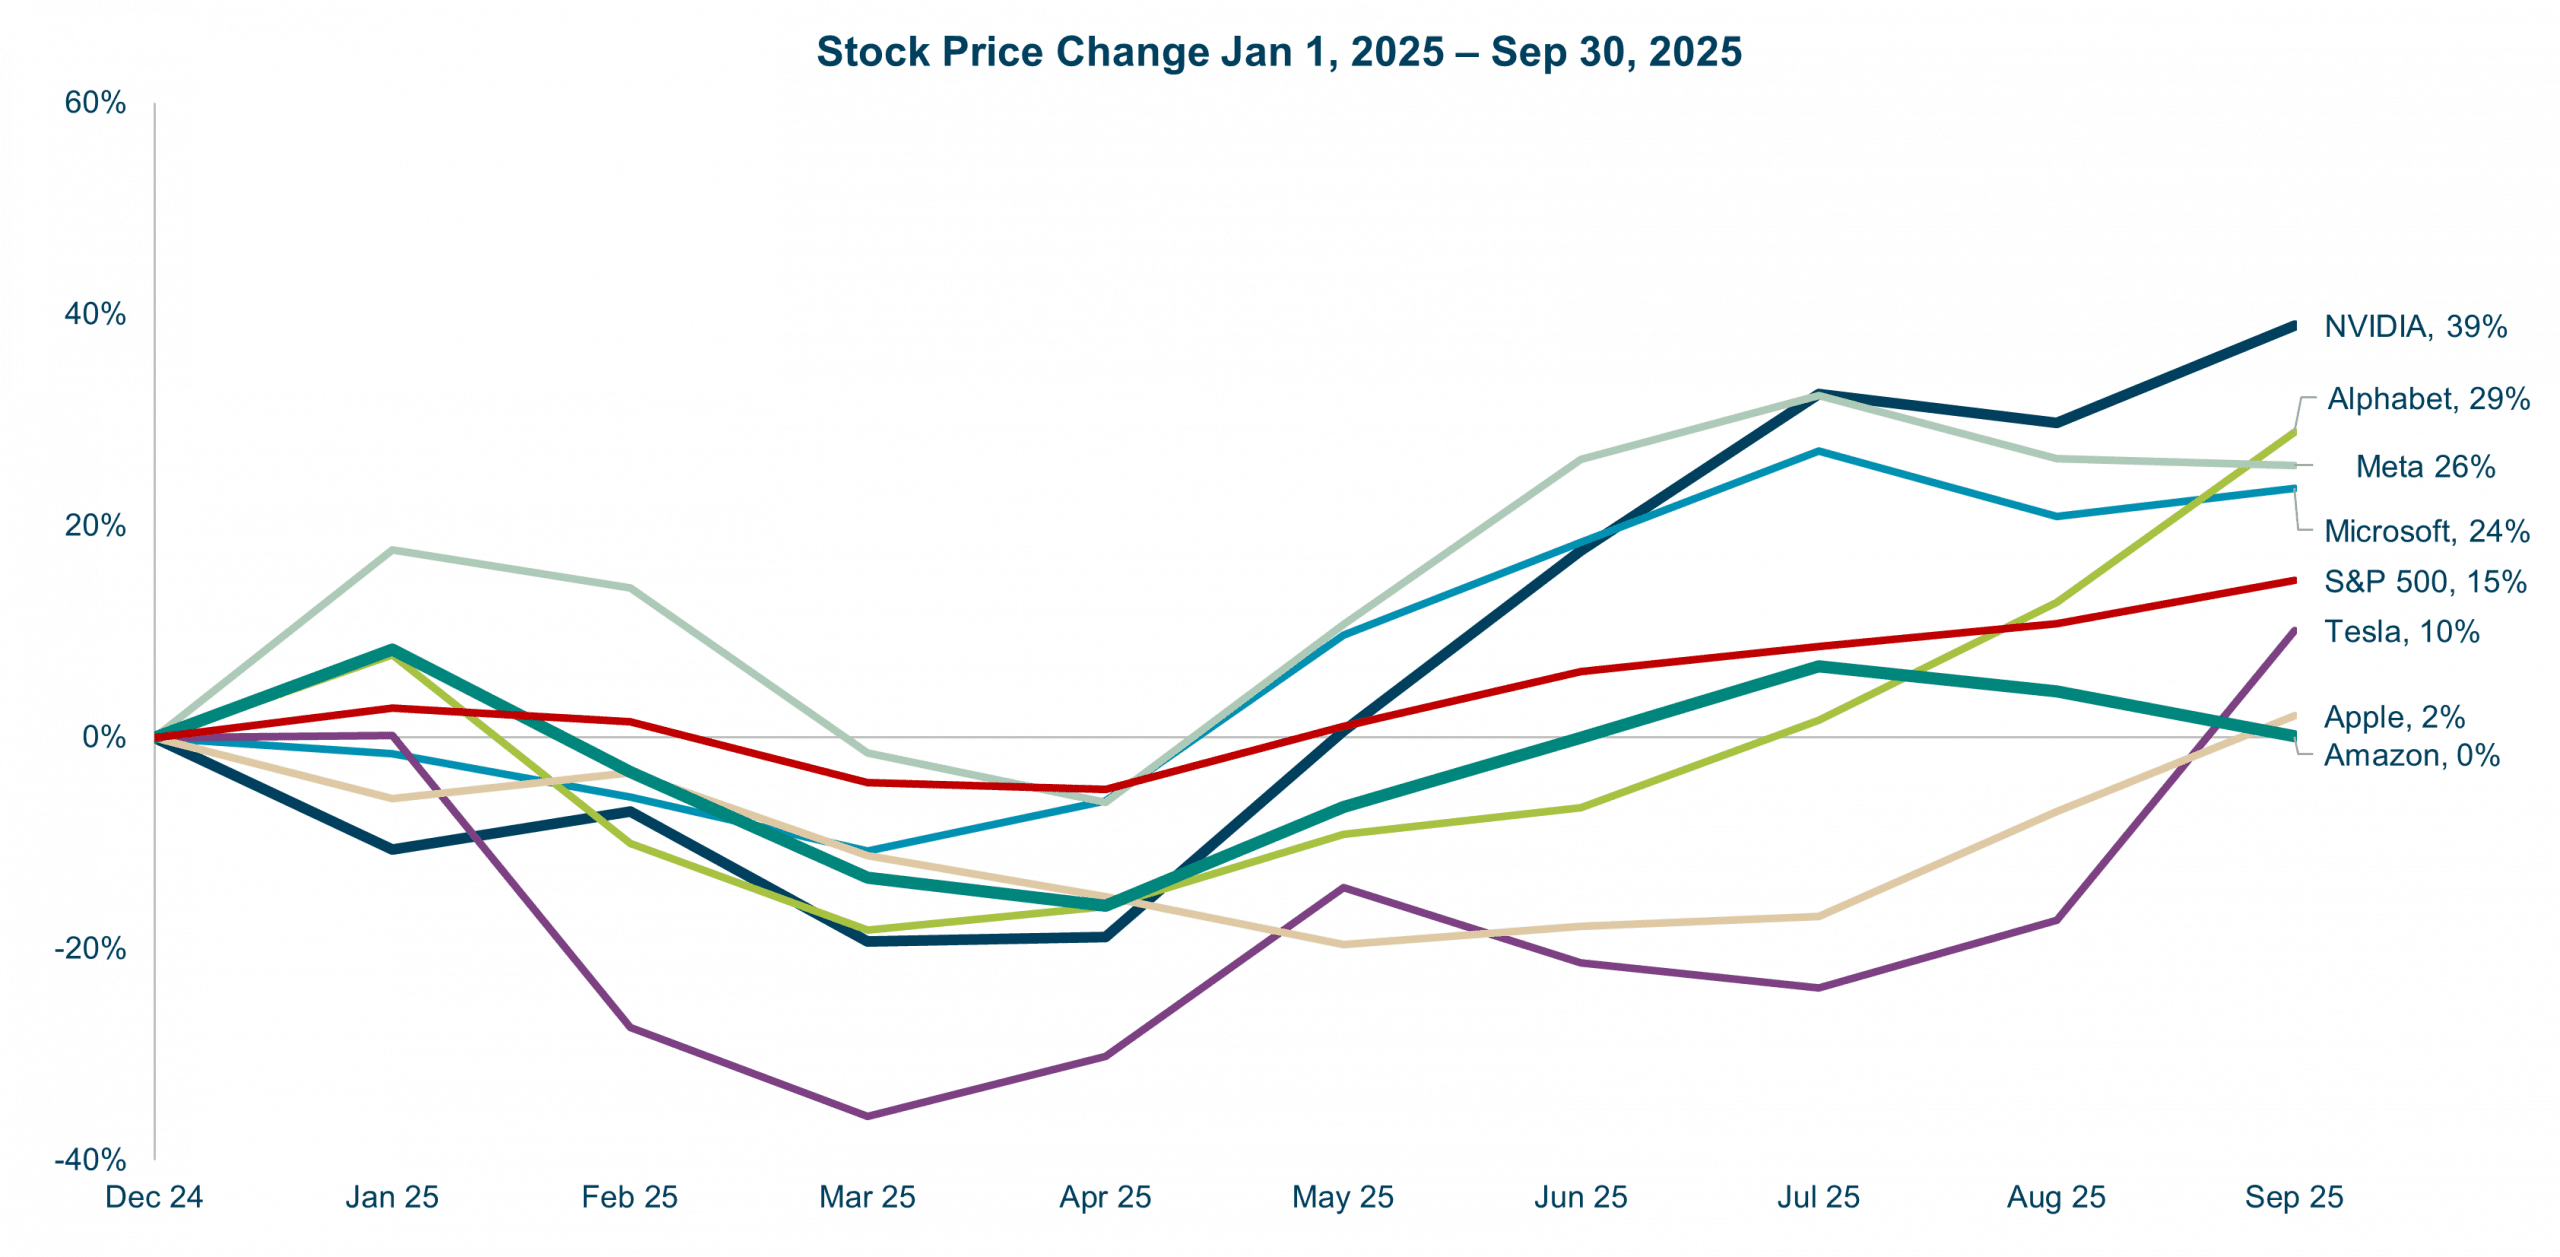
Chart: Stock Price Change Jan 1, 2024 – Sept. 30, 2025, comparing Apple, Nvidia, Meta, Amazon, Tesla, Microsoft, & Alphabet¹¹
Fixed Income & Yield Curve
Domestic fixed income markets had strong returns in the third quarter, building on Q2 gains, as yields moved lower and credit spreads tightened for both investment grade and high yield bonds. The Fed delivered its first interest rate cut of the year in September, trimming the target federal-funds rate to a range of 4%-4.25%. As a result, the yield curve steepened modestly as short-term yields moved lower while long-term yields held steady, reflecting market expectations for persistent inflation and elevated deficits.¹²
Sustainable debt markets expanded meaningfully in the first half of 2025, signaling ongoing growth in climate and transition finance alongside traditional equity strength. Issuance of green, social, sustainability, sustainability-linked, and transition (GSS+) bonds reached $615.9 billion, up about 14% from the same period last year. Green bonds continued to lead the way, representing over 60% of total issuance ($384.9 billion).¹³ With policy momentum outside of the US ahead of COP30 and stronger participation from emerging markets, the sustainable debt market is on course to exceed $1.2 trillion in total issuance for 2025.
Distorted Recovery and Economic Divide
It appears to us that the US economy is increasingly “winner-take-all” with a few top earners and major stocks posting wild gains, while the majority are grappling with rising costs, from housing and healthcare to groceries. Polling shows many Americans saying that they are experiencing stress because of these additional costs.¹⁴
Sales of cheap food staples have surged, and low-cost restaurant searches are up sharply; pet surrenders in shelters have risen. These each reflect rising household budget strains. Meanwhile, more FHA borrowers are falling behind on their mortgages. That’s especially concerning for first-time buyers and lower-income families trying to secure a foothold on the otherwise strong housing market.
We believe the widening gaps in access to healthcare, affordable housing, and basic needs doesn’t just challenge individual families. It puts pressure on community resilience and could weigh on broader economic sentiment.
Portfolio and Investment Implications
Reaching new stock market highs can be a time for re-evaluation. Veris advisors are working with clients to assess how recent gains may offer opportunities to enhance portfolio resilience.
We believe the market’s ambivalence towards unstable government policy and decreasing availability of reliable economic data from the government remains a risk to this market strength. For many investors, the gains have created new financial flexibility to consider deeper alignment between their portfolios and their missions– particularly through sustainable debt and other impact-oriented strategies discussed earlier in this article.
We look forward to exploring these opportunities with interested clients in the months ahead and remain inspired by our clients who are seeking opportunities to meet the moment through the portfolios.
Authors
Jane Swan is a Partner, Senior Advisor, and Chief Advisory Officer at Veris, and she holds the Chartered Financial Analyst (CFA®) designation. Bio.
Roraj Pradhananga is a Partner and Chief Investment Officer at Veris and a Certified Investment Management Analyst (CIMA®) and Certified Public Accountant (CPA). Bio.
Disclaimer
The information contained herein is provided for informational purposes only and should not be construed as the provision of personalized investment advice, or an offer to sell or the solicitation of any offer to buy any securities. Rather, the contents including, without limitation, any forecasts and projections, simply reflect the opinions and views of the authors. All expressions of opinion reflect the judgment of the authors as of the date of publication and are subject to change without notice. There is no guarantee that the views and opinions expressed herein will come to pass. Additionally, this document contains information derived from third party sources. Although we believe these third–party sources to be reliable, we make no representations as to the accuracy or completeness of any information derived from such third-party sources and take no responsibility, therefore. Information related to the performance of certain benchmark indices is provided for illustrative purposes only as investors cannot invest directly in an index. Past performance is not indicative of or a guarantee of future results. Investing involves risk, including the potential loss of all amounts invested. The information contained in this document also contains certain forward-looking statements, often characterized by words such as “believes,” “anticipates,” “could,” “plans,” “expects,” “projects,” and other similar words that indicate future possibilities. Due to known and unknown risks, other uncertainties and factors, actual results may differ materially from the expectations portrayed in such forward-looking statements.
Sources
3. U.S. Bureau of Economic Analysis, FRED, and U.S. Bureau of Labor Statistics
4. https://news.umich.edu/consumer-sentiment-declines-amid-concerns-about-inflation-unemployment/
5. U.S. Bureau of Labor Statistics
7. New data shows US job growth has been far weaker than initially reported | CNN Business
9. Morningstar, FRED
10. Morningstar, S&P Global
11. Morningstar, J.P. Morgan Asset Management
12. U.S. Department of the Treasury
13. https://www.climatebonds.net/data-insights/publications/sustainable-debt-global-state-market-h1-2025
15. https://www.nbcnews.com/business/economy/animal-shelters-full-pets-expensive-inflation-rcna221043


