
Economic & Market Update: Q2 2025
By Jane Swan, CFA and Roraj Pradhananga, CIMA & CPA
After considerable volatility from late February through April, markets have stabilized and have reached new record highs, seemingly unaffected by persistent uncertainty. Although unpredictable tariff policy, unprecedented executive actions, and a budget bill projected to dramatically expand the federal deficit remain ongoing concerns, market volatility in response to these developments has diminished.
Firings of senior officials – including those responsible for overseeing the collection and reporting of key economic and statistical data – could threaten the integrity and reputation of the organizations along with the financial market’s confidence in the data they provide. Even before these dismissals, we believe there was a noticeable decline in the quality of inflation statistics, with the Bureau of Labor Statistics increasing its use of estimates from a historical average of 10% to 30%.¹ As we examine the economy and markets, we note that the relationship between data and market responses may be evolving.
US Economic Review – Economic Growth
The uncertainty surrounding US policy is weighing on the economy, 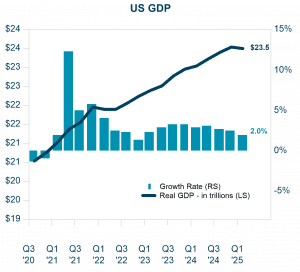 with GDP expanding just 2% year-on-year in the first quarter of 2025 – the slowest rate of growth since late 2022. This slowdown was largely driven by a surge in imports, as businesses and consumers accelerated purchases ahead of anticipated tariff increases. While not recessionary, this growth rate falls significantly short of the post-1948 historical average of 3.15%. Moreover, real GDP–which adjusts for inflation–actually declined at an annualized rate of 0.5% in the first quarter.² With the spike in imports now behind, Q2 real GDP growth is expected to be positive.³
Source: U.S. Bureau of Economic Analysis, FRED
Retail sales in the US were erratic in Q2 as they increased 0.6% month-over-month in June, after declining 0.9% in May,⁴ which followed a downwardly revised 0.7% drop in April. Sales at motor vehicle & parts dealers were flat in Q2 compared to Q1 but recorded the largest decline of -3.8% in May. These are some of the industries with the potential to be most impacted by threats of tariffs.
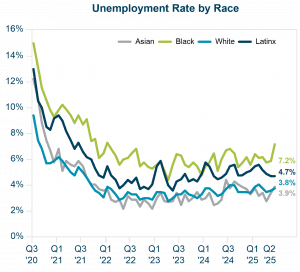 While still resilient, the labor market showed signs of softening in Q2, as job gains for May and June were significantly revised downward by a combined ~250,000 jobs in July’s release. June’s job gains were concentrated in the public sector, with state and local governments hiring. Hirings were highest in education, offsetting a fifth consecutive monthly decline in federal employment. The unemployment rate dropped to 4.1% in June from 4.2% in March; however, the unemployment rate for Black Americans jumped to 7.2% in June.
Sources: U.S. Bureau of Economic Analysis, FRED, and U.S. Bureau of Labor Statistics
As the labor market continues to soften, it could result in further headwinds to economic growth and prompt the Fed to cut interest rates.
Tariffs, Inflation and the Fed
As the Trump Administration continues to pressure the Federal Reserve to cut interest rates, resistance from the Federal Open Market Committee (FOMC) can be explained by a mix of economic indicators. Despite the political pressure on Chair Powell to cut rates, the committee of seven continues to have majority support for prudence in keeping rates steady as the economy absorbs shifts in inflation and unemployment. The bond market has so far reacted by increasing long and intermediate treasury yields as the independence of the Fed has been questioned,⁵ as Chair Powell’s term will end in May 2026.
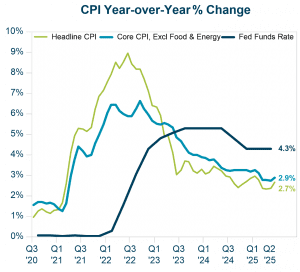 Core inflation rose by 2.9% year-over-year and 0.2% month-over-month in June, driven by rising prices in tariff-affected categories like furnishings, apparel, and recreational goods. Inflation came in below expectations as many companies have not fully passed tariff-related costs onto consumers, given the ongoing uncertainty over trade negotiations and potential extensions. Goldman Sachs reports that US businesses have absorbed more than half of the costs of tariffs with rest paid by foreign exporters and consumers. However, over the coming months, the burden is expected to shift more toward the US consumers.⁶ As the passthrough effects of President Trump’s tariffs continue to filter through to the economy, this is likely to place additional upward pressure on inflation in coming quarters with potential offsets from a slowing labor market.
Escalating tariffs have the potential to create broad-based economic disruption across all major asset classes and economic indicators. They also have the potential to fundamentally disrupt economic activity through multiple interconnected channels, with effects cascading throughout the global financial system with a myriad of effects, only some of which are predictable.
- Tariffs can systematically reduce economic output due to demand destruction of higher costs, decrease business productivity and capital investments.
- Inflationary pressures on imported goods can function as a regressive tax on consumers.
- Stock markets might experience varying degrees of impact by sector exposure and supply chain dependencies and companies with lower pricing power might face downward valuation adjustment.
- Corporate bond markets might experience disruption through yield curve volatility and spreads widening. Treasury yields may rise further due to inflation expectations and fiscal concerns.
- Private markets may face greater severity of valuation adjustments due to the illiquid nature and longer investment horizons.
Stock Market Update
Despite or perhaps in response to all of the above, stock markets delivered 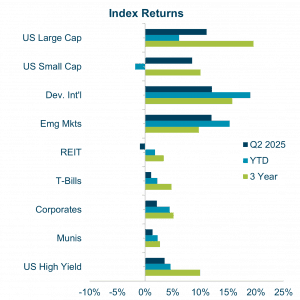 strong returns in the second quarter. This was fueled by strong corporate earnings and an improving economic outlook compared to the prior quarter. This largely overlooks policy uncertainty and geopolitical tensions. The S&P 500 recovered sharply in the quarter, gaining 11% from mid-April lows and closing near its all-time high. After a sharp sell-off in April, US equity markets rebounded in the second quarter. Technology stocks regained momentum, led once again by AI-related names. Value and small-cap stocks – strong performers in the first quarter – slightly lagged in Q2 but still delivered positive returns.
Sources: Morningstar, FRED, and US Department of the Treasury
International developed and emerging markets advanced as well, supported by ongoing stimulus measures in Europe and China and by rising investor demand for diversified global exposure.
Stock Market Update — Sector Focus
The S&P 500 index posted a robust 11% gain in Q2. This quarter, Technology, Communication  Services, and Consumer Discretionary sectors — previously among the worst performers — drove the market’s recovery. Notably, Consumer Discretionary stocks surged despite persistent concerns over tariffs and a slowing economy.
Mega-cap tech stocks like Nvidia, Meta, Amazon and Microsoft continue to fuel the recovery. By contrast, defensive sectors like Energy and Healthcare, which had shown strength in Q1, lagged behind this quarter.
Source: Morningstar

Source: Morningstar, S&P Global, and MSCI
Bond Market Update
Bond markets posted modest gains as yields held relatively stable. The Treasury yield curve steepened slightly, with longer-term yields rising marginally amid deficit concerns and declining global appetite for US dollar denominated debt. Credit spreads also narrowed during the quarter indicating higher bond valuations.

Source: US Department of the Treasury
The Federal Reserve kept interest rates unchanged during the quarter, maintaining a wait-and-see stance as inflation eased modestly and labor market signals remained mixed. The target federal funds rate stayed at 4.25%–4.50%.
Looking Forward — The 2025 Budget Bill
The 2025 Tax Bill extends the 2017 tax cuts by borrowing more, while also cutting funding for social safety net programs. This approach is expected to increase the national debt by $3.4 trillion. Larger deficits may lead to higher interest rates on Treasury bonds, causing the government to pay more in interest and reducing government expenditures that support the economy. According to Yale’s Budget Lab, the bill is also projected to benefit mainly higher-income households, making its effects regressive and potentially exacerbating wealth inequality.⁷


Source: FRED, Congressional Budget Office, The Budget Lab at Yale. 1. After tax and transfers. Note: “Senate, as written” assumes temporary provisions within the bill will expire as scheduled.
Over the past 35 years, there has been a dramatic increase in overall wealth in the United States. Since 1989, total U.S. wealth has surged from around $25 trillion to over $209 trillion. During this period, the wealth held by the poorest 50% of Americans rose from $711 billion to $4 trillion—a 560% increase. However, this growth pales in comparison to that of the top 1%. The wealthiest 1% saw their holdings climb from $4.65 trillion to more than $49 trillion, representing a 1,053% increase. This reflects a significant concentration of wealth among the richest Americans over the past three and a half decades.

Source: Federal Reserve Economic Data, Federal Reserve Bank of St. Louis
The Yale Budget Lab estimates that Trump’s tariffs, combined with his budget bill, will lower after-tax incomes for the bottom 80% of U.S. households. According to their analysis, the poorest 10% could see average income declines of 6.5%, while the wealthiest households stand to gain an average of 1.5%.⁹
We’re inspired by the ways Veris clients are making a difference — from charitable giving to investing in innovative companies tackling the impacts of the budget bill.
With many portfolios strengthened by recent market trends, now is a great time to connect with your advisor to review your portfolio and explore adjustments that align with your values and goals.
Authors
Jane Swan is a Partner, Senior Advisor, and Chief Advisory Officer at Veris, and she holds the Chartered Financial Analyst (CFA®) designation. Bio.
Roraj Pradhananga is a Partner and CIO at Veris and a Certified Investment Management Analyst (CIMA®) and Certified Public Accountant (CPA). Bio.
Sources
1. The Quality of CPI Data Continues to Deteriorate – Apollo Academy
2. Gross Domestic Product, 1st Quarter 2025 (Third Estimate), GDP by Industry, and Corporate Profits (Revised) | U.S. Bureau of Economic Analysis (BEA)
3. Gross Domestic Product, 2nd Quarter 2025 (Advance Estimate) | U.S. Bureau of Economic Analysis (BEA)
4. https://www.census.gov/retail/marts/www/marts_current.pdf
5. https://www.morningstar.com/markets/why-feds-independence-matters-markets-economy-your-wallet
8. Federal Reserve Economic Data, Federal Reserve Bank of St. Louis
Disclaimer
The information contained herein is provided for informational purposes only and should not be construed as the provision of personalized investment advice, or an offer to sell or the solicitation of any offer to buy any securities. Rather, the contents including, without limitation, any forecasts and projections, simply reflect the opinions and views of the authors. All expressions of opinion reflect the judgment of the authors as of the date of publication and are subject to change without notice. There is no guarantee that the views and opinions expressed herein will come to pass. Additionally, this document contains information derived from third party sources. Although we believe these third–party sources to be reliable, we make no representations as to the accuracy or completeness of any information derived from such third-party sources and take no responsibility, therefore. Information related to the performance of certain benchmark indices is provided for illustrative purposes only as investors cannot invest directly in an index. Past performance is not indicative of or a guarantee of future results. Investing involves risk, including the potential loss of all amounts invested. The information contained in this document also contains certain forward-looking statements, often characterized by words such as “believes,” “anticipates,” “could,” “plans,” “expects,” “projects,” and other similar words that indicate future possibilities. Due to known and unknown risks, other uncertainties and factors, actual results may differ materially from the expectations portrayed in such forward-looking statements.