Economic Perspective Q3 2017
By Jane Swan, CFA, Senior Wealth Manager
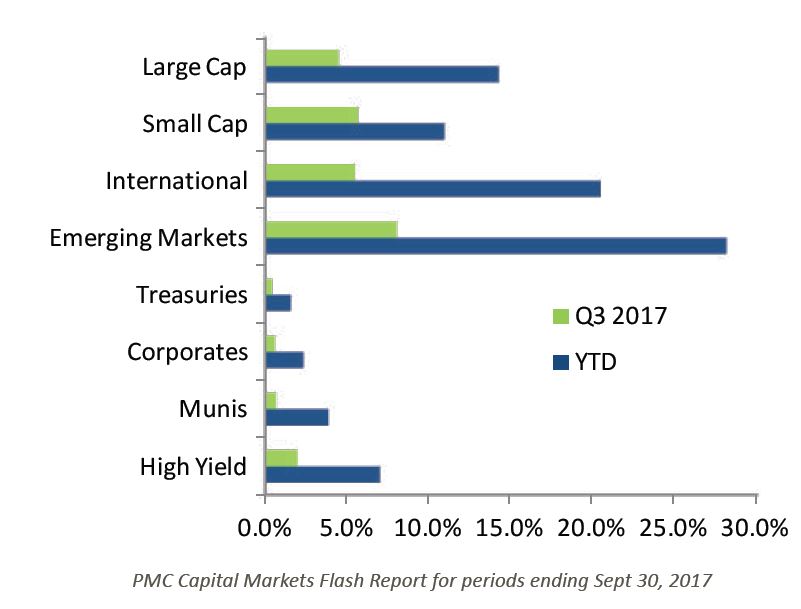
Despite hurricanes, earthquakes, wildfires, and ongoing political chaos, markets climbed higher in the third quarter. The S&P 500 (U.S. large cap) was up 4.5 percent in the quarter, bringing year to date (YTD) growth to 14.2 percent. The Russell 2000 (small cap) was even stronger during the quarter, up 5.7 percent with YTD growth of 10.9 percent. If developed and emerging international markets hold their positions, they will be the best-performing risk asset classes for the first time in almost ten years. The MSCI EAFE (developed international equities) continued its rebound and was up 5.5 percent for the quarter and 20.5 percent for the year. Strongest of the major equity benchmarks was the MSCI Emerging Markets index, up 8 percent in the quarter and 28.1 percent for the year.
2017 Q3 Asset Class Returns
Within U.S. equity markets, the strongest performance came from the technology sector, up 8.7 percent in the quarter and 24.7 percent for the year. Market strength was also supported by advances in energy, telecom, materials, financials, and industrials. Health care, utilities and consumer discretionary sectors were also modestly positive in the quarter. Consumer staples was the only negative sector in the quarter. Despite strong growth in the quarter from energy and telecom, these are the only two sectors that are negative so far this year.
2017 Q3 Sector Returns
Fixed income returns remained positive, despite the two small interest rate hikes earlier in the year. US Treasuries were up 0.4 percent for the quarter and 1.6 percent for the year. Intermediate corporate bonds were up 0.6 percent for the quarter and 2.3 percent for the year. Intermediate municipals were up 0.7 percent for the quarter and 3.9 percent for the year. High-yield bonds, benefiting from continued economic expansion, were up 2 percent in the quarter bringing year to date return to 7 percent.
The run-up in high-yield bonds reflects further compression in the interest rate spread. The spread is the difference in yield paid on a Treasury bond and a high-yield (sometimes called “junk”) bond. Some view this spread as an indicator of future economic risk. If we anticipate continued economic strength, we do not recognize significant risk of default from even a low credit quality borrower. As a result, we are willing to buy the low-quality bond for just a small premium of additional income. If we believe the economy will be facing headwinds, we should require a higher increase in income when we buy a lower-quality bond. A contrary viewpoint suggests that investors can be overly influenced by stock market momentum. When markets are in long expansions, we seemingly forget that markets can go down. We forget to price in a premium for risky investments. It may take months or years to know if today’s narrow interest rate spreads were a sign of overly optimistic investors or an appropriate measure of a strong economy.
Effective Fed Funds Rate
While bondholders may seem complacent, many equity investors are feeling uneasy about the possibility of a significant market downturn (“correction”). The length and magnitude of this expansion has many wondering how long this will last. Starting about four-and-a-half-years ago, news headlines have frequently celebrated each new market high. With each new record came the question, “How long will the market’s run last?” While we won’t know the answer until it actually ends, it is helpful to understand how this expansion relates to other market expansions.
Measuring Market Expansions
Using the S&P 500 for reference and examining this market expansion in relation to prior market expansions, we see that the current bull market is one of the longest and strongest. However, it is not the longest nor is it the strongest. This expansion, having started in the beginning of March 2009, has lasted 103 months (8.6 years). That makes it the second-longest expansion. The longest expansion started in November 1990 and lasted until the dot-com bubble burst 118 months (9.8 years) later. To become the longest market expansion, our current growth would have to go for at least another 15 months.
Measuring the return of the expansion, we find a market gain of 243 percent from the prior low in 2009. There have been two greater market expansions in history. The greatest being that same expansion from the 1990s, when the market grew 399 percent. The second-greatest expansion was just after World War II. Beginning February of 1948, the market went up 246 percent in just over 8 years. To become the largest market expansion in history, our stock market would have to go up at least an additional 156 percent.
While the stock market has been growing significantly for a long time, these factors alone do not mean that an end is near.
There are several issues of greater concern than the length and magnitude of the expansion. A troubling aspect of this expansion is that it has left many behind. Real wage growth for non-supervisory workers dropped significantly in the 1980s and has not recovered. Suppressed wages hurt consumers’ ability to sustain growth in spending. The market has also seemingly shrugged off the increase in long-term potential risks from reduced regulations. These include reductions to environmental regulations and consumer protections, as well as regulations focused on preventing the kind of corporate risk-taking that led to the last economic decline. The market has been unphased by the inability of the branches of government to implement previously expected changes, such as building “the wall” or repealing the Affordable Care Act. It is unclear what, if any, portion of earnings forecasts or recent price appreciation is tied to optimism from financial analysts about possible tax cuts.
Growth in Earnings
For most of the last four years of this market expansion, great speculation has focused on the next bubble to burst. Would it be commercial real estate? Gold? The dollar? Or something else? Regardless of when, why and by how much the market retreats, your Veris Wealth Advisor is here to partner with you in structuring a portfolio that incorporates your spending goals across a variety of market cycles.